present
ลงทะเบียนและรับส่วนลด $50 สำหรับการซื้อครั้งแรกของคุณ
Trading product for RiskRewardTool อินดิเคเตอร์ BTCUSD Forex, image 1
RiskRewardTool
อินดิเคเตอร์
239 ดาวน์โหลด
เวอร์ชัน 1.0, Mar 2026
Windows, Mac
Trading product for RiskRewardTool อินดิเคเตอร์ BTCUSD Forex, image 2
Trading product for RiskRewardTool อินดิเคเตอร์ BTCUSD Forex, image 3
Trading product for RiskRewardTool อินดิเคเตอร์ BTCUSD Forex, image 4
Trading product for RiskRewardTool อินดิเคเตอร์ BTCUSD Forex, image 5
Trading product for RiskRewardTool อินดิเคเตอร์ BTCUSD Forex, image 6
Trading product for RiskRewardTool อินดิเคเตอร์ BTCUSD Forex, image 7
ตั้งแต่ 14/01/2025
62
การขาย
12.44K
ติดตั้งฟรี

คำอธิบาย

ถึงแม้ว่าฉันจะชอบ cTrader มาก แต่การอัปเดตล่าสุดสำหรับเครื่องมือ Risk Reward นั้นทำให้หงุดหงิดในบางครั้ง ฉันไม่ชอบที่มันล็อกแกน y ของคุณ ดังนั้นฉันจึงสร้างอันนี้ขึ้นมาแทน

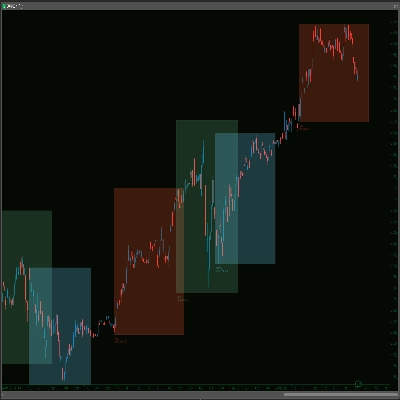
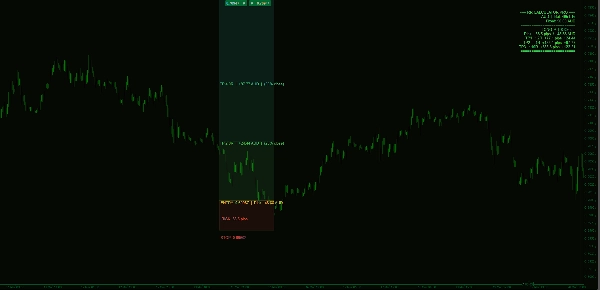
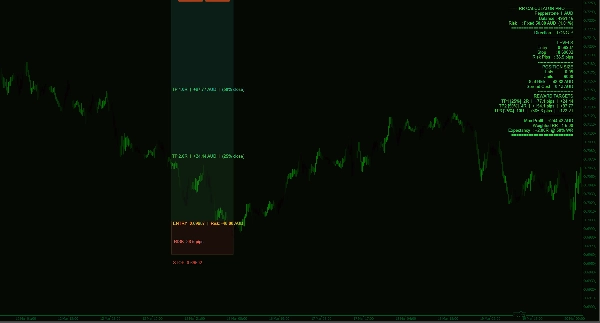
RR Calculator Pro ให้คุณมีอิสระเต็มที่กับกราฟในขณะที่ลบการคำนวณด้วยตนเองทุกอย่างออกจากการวางแผนการเทรดของคุณ วาดสี่เหลี่ยมผืนผ้าครอบคลุมจุดเข้าซื้อและจุดหยุดขาดทุนของคุณ ใส่ป้ายกำกับในพื้นที่คอมเมนต์เป็น RRL สำหรับการซื้อ หรือ RRS สำหรับการขาย และตัวชี้วัดจะคำนวณและแสดงทุกอย่างที่คุณต้องการทันที ก่อนวางคำสั่งซื้อ

วิธีการทำงาน
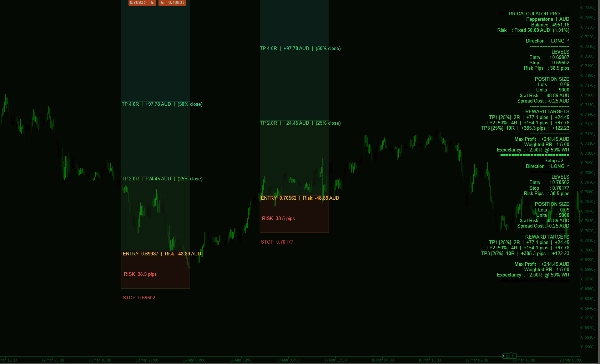
สี่เหลี่ยมผืนผ้าที่คุณวาดคือโซนความเสี่ยงของคุณ ความสูงของมันกำหนดระยะหยุดขาดทุนของคุณเป็นพิป ตัวชี้วัดจะอ่านระยะทางนั้น ใช้จำนวนความเสี่ยงที่คุณเลือก และคาดการณ์สามโซนทำกำไรเหนือหรือใต้โซนนั้น — ทั้งหมดถูกจัดให้อยู่ภายในความกว้างของสี่เหลี่ยมผืนผ้าของคุณ ไม่มีเส้นที่ยืดออกไปทั่วกราฟของคุณ ไม่มีความยุ่งเหยิง

การกำหนดขนาดตำแหน่ง
เลือกจากโปรไฟล์ความเสี่ยงแบบอนุรักษ์นิยม (0.5%), ปกติ (1%), รุนแรง (2%) หรือกำหนดเอง — หรือข้ามการกำหนดขนาดตามเปอร์เซ็นต์โดยป้อนจำนวนเงินดอลลาร์คงที่ ตั้งค่าความเสี่ยงเป็น $58 และการคำนวณทั้งหมดจะไหลจากตัวเลขนั้น ขนาดล็อตที่แน่นอน จำนวนหน่วย ความเสี่ยงดอลลาร์ และต้นทุนสเปรดของคุณจะแสดงทันที

โซนทำกำไร
สามค่าตัวคูณรางวัลที่ปรับแต่งได้ (ค่าเริ่มต้น 1R, 2R, 3R) ถูกวาดเป็นโซนที่มีสีแตกต่างกันซึ่งคาดการณ์จากจุดเข้าซื้อของคุณ แต่ละโซนแสดงระยะทางพิป กำไรดอลลาร์ที่เป้าหมาย และเปอร์เซ็นต์การปิดบางส่วน โซนเหล่านี้ไล่ระดับจากสีเขียวอ่อนไปยังสีเขียวสดใส ให้การอ่านภาพทันทีเกี่ยวกับศักยภาพของรางวัล

อัตราส่วนความเสี่ยง:ผลตอบแทนในพริบตา
แดชบอร์ดแสดงอัตราส่วน R:R ที่ถ่วงน้ำหนักของคุณ (คำนึงถึงการปิดบางส่วน) กำไรสูงสุดรวมทั้งหมดในทุกเป้าหมาย และค่าคาดหวังที่อัตราชนะ 50% โหมดด่วนย่อทุกอย่างลงในหกบรรทัดสำหรับเทรดเดอร์ที่ชอบพื้นที่หน้าจอน้อย

การตั้งค่าหลายรายการพร้อมกัน
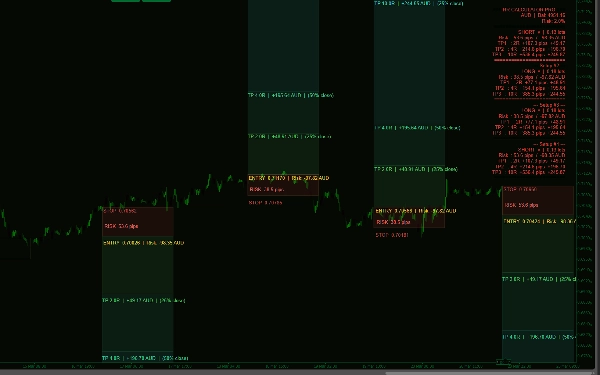
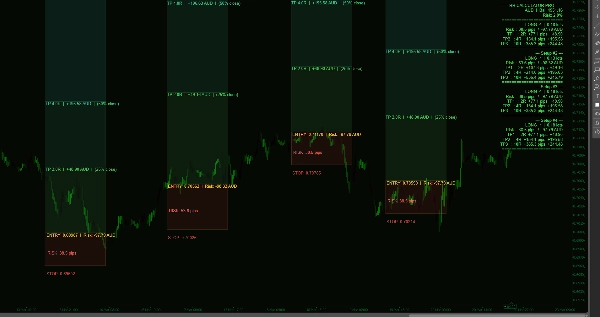
วาดสี่เหลี่ยม RRL และ RRS ได้มากเท่าที่คุณต้องการ แต่ละอันคำนวณแยกกัน และแดชบอร์ดจะจัดเรียงการตั้งค่าทั้งหมดในแผงเดียว — ไม่มีการทับซ้อน ไม่มีความสับสน

การจัดแนวป้ายกำกับ
ป้ายกำกับทั้งหมดสามารถยึดติดกับขอบซ้ายหรือขวาของสี่เหลี่ยมผืนผ้าของคุณ — มีประโยชน์ขึ้นอยู่กับตำแหน่งของสี่เหลี่ยมผืนผ้าบนกราฟของคุณ

ขอให้เทรดอย่างมีความสุข! โชคดี!

สรุป

สรุปโดย AI
RiskRewardTool is a trading indicator designed to simplify risk and reward calculations on charts. Users draw a rectangle spanning their entry and stop loss levels, labeling it "RRL" for long positions or "RRS" for short positions. The rectangle’s height defines the stop distance in pips, which the tool uses to calculate position size based on selected risk profiles (Conservative 0.5%, Normal 1%, Aggressive 2%) or a fixed dollar risk amount. It then projects three configurable take profit zones (default multiples 1R, 2R, 3R) as color-coded areas on the chart, showing pip distances, potential dollar profits, and partial close percentages. The dashboard provides a weighted risk-to-reward ratio accounting for partial closes, maximum total profit, and expectancy at a 50% win rate. Multiple setups can be drawn and calculated independently, with all results consolidated in a single panel. Labels can be anchored to either side of the rectangle for chart clarity. The tool supports various markets and symbols including Forex pairs (EURUSD, GBPUSD, NZDUSD, USDJPY), cryptocurrencies (BTCUSD), indices (NAS100), commodities (XAUUSD), and stocks. It aims to provide clear, clutter-free visual trade planning without manual calculations.
โปรไฟล์อินดิเคเตอร์

รีวิวจากลูกค้า

0.0
รีวิว: 0
รีวิวจากลูกค้า
ยังไม่มีรีวิวสำหรับผลิตภัณฑ์นี้ หากเคยลองแล้ว ขอเชิญมาเป็นคนแรกที่บอกคนอื่น!

การสนทนา

คำถามที่พบบ่อย

BTCUSD
Forex
Signal
Breakout
Indices
EURUSD
Commodities
GBPUSD
NZDUSD
Scalping
Fair Value Gap
SMC
Crypto
Stocks
XAUUSD
NAS100
ATR
USDJPY
ผลิตภัณฑ์ที่มีให้บริการผ่าน cTrader Store รวมถึงบอทการเทรด อินดิเคเตอร์ และปลั๊กอิน มีให้บริการโดยนักพัฒนาบุคคลที่สามและมีไว้เพื่อวัตถุประสงค์ในการเข้าถึงข้อมูลและทางเทคนิคเท่านั้น cTrader Store ไม่ใช่โบรกเกอร์และไม่ได้ให้คำแนะนำการลงทุน คำแนะนำส่วนบุคคล หรือการรับประกันผลการดำเนินงานในอนาคต

เพิ่มเติมจากผู้เขียนคนนี้

"Market Sessions - Free" โลโก้
เรตติ้งสูง
4.1
(8)
ฟรี
อินดิเคเตอร์
Forex
Crypto
+3
Track major trading sessions (Tokyo, London, New York) with customizable colors and visual sessions on your chart.
อินดิเคเตอร์
Auto-detect supply & demand zones, remove broken levels, and trade smarter with real-time alerts. Precision made simple.
อินดิเคเตอร์
Forex
Market Session V2: Full Control. colors, history, session/text toggles, font size. Elevate your strategy!
อินดิเคเตอร์
Forex
Version 3: Full control of session display including start and end times of all 3 sessions!
อินดิเคเตอร์
Supply and demand zones. They're important. Here's a free version to get you started!
อินดิเคเตอร์
The Multi-Timeframe Candle Indicator displays candles from multiple timeframes in one window, enhancing market analysis!
อินดิเคเตอร์
VWAP
VWAP Set to London Open
อินดิเคเตอร์
The long awaited new and improved Supply Demand Premium V2 indicator. Unlock greater trading opportunities now!
อินดิเคเตอร์
SMC
Prop
+13
Smart Money Suite (Lite): BOS, CHoCH, Swing structure, PDH/PDL & session killzones. Essential SMC tools, zero clutter.
อินดิเคเตอร์
AI
SMC
+17
Smart Support/Resistance lines auto calculated from D1/H4/H1/M15. Highly customizable visuals + built in Backtest Mode.
อินดิเคเตอร์
Forex
EURUSD
+3
US Dollar Index
"8 Currencies_NSC" โลโก้
ยอดนิยม
4.4
(5)
$19
อินดิเคเตอร์
Forex
NZDUSD
+2
RCS: 8 majors! AUD,USD,EUR,JPY,GBP,CAD,CHF,NZD. Find how strong each currency is relatively and trade smarter!

นอกจากนี้คุณยังอาจชอบ

"LT Flexible Volume Profile" โลโก้
ยอดนิยม
5.0
(3)
$19
อินดิเคเตอร์
Forex
Flexible Volume Profile, designed with performance in mind.
อินดิเคเตอร์
Pin Bar
Inducement
+5
Institutional Nasdaq Session Liquidity Map with Live Point HUD, Sweep Alerts & Interactive Playbook.
อินดิเคเตอร์
Pin Bar
Inside Bar
+2
Advanced candlestick pattern recognition with structural quality scoring, alerts and adaptive chart visuals.
อินดิเคเตอร์
BOS
Flag
+5
Detect consolidation zones. Heatmap shows activity density. Body vs wick scoring reveals true strength zones.
"Half Trend BT" โลโก้
ยอดนิยม
4.3
(3)
$50
/
$100
อินดิเคเตอร์
Prop
Forex
+5
Half Trend – Trend Reversal Indicator for cTrader
อินดิเคเตอร์
Prop
Forex
+10
Heatmap Pro analiza la volatilidad, el volumen y la acción del precio para "pintar" tu gráfico con zonas de color.
อินดิเคเตอร์
Key Levels
Spots key hourly ranges and signals breakouts using arrows & colored background zones. Ideal for Gold.
อินดิเคเตอร์
ATR
EMA
+4
Range-filter BUY/SELL signals scored by four confluence layers, with a stop, five targets and a trend panel
"SwingHighLowDetector" โลโก้
เรตติ้งสูง
4.8
(5)
$25
/
$35
อินดิเคเตอร์
Prop
Forex
+12
Introducing High Accuracy multi timeframe Swing high and low detector.
อินดิเคเตอร์
ATR
RSI
+5
Multi-factor VWAP mean-reversion signals with ATR bands, volume exhaustion, and RSI gate on cTrader.
อินดิเคเตอร์
Breakout
Allow trader to visualize Support & Resistance across different timeframes,give trader an overview of the current market
"Stochastic RSI PRO" โลโก้
เรตติ้งสูง
4.6
(6)
$28
/
$40
อินดิเคเตอร์
RSI
Prop
+14
Unlock Stochastic RSI PRO in cTrader! Overlay RSI, highlight zones, and identify divergences with customizable settings.
อินดิเคเตอร์
Prop
Forex
+4
Risk Reward Management Tools(风险回报管理工具)
อินดิเคเตอร์
Advanced price action tool that combines multiple technical analysis concepts
"ZigzagSR" โลโก้
ยอดนิยม
4.2
(4)
$19
/
$30
อินดิเคเตอร์
RSI
XAUUSD
+2
Automatic ZigZag swings with dynamic support & resistance levels, labeling highs/lows for clear trend signals.
อินดิเคเตอร์
Prop
Forex
+13
Color Volume Bars – Visualize Market Strength Instantly
อินดิเคเตอร์
EMA
AI-assisted
+1
Multi EMA Timeframes lets you stay on your chart and see the exact EMA from any timeframe you choose — up to 5 at once.
อินดิเคเตอร์
Volume
Channel
+3
A higher-timeframe log-regression channel with a volume profile, Point of Control and session levels.

ราคา

ตั้งแต่ 14/01/2025
62
การขาย
12.44K
ติดตั้งฟรี