
FVG_tidypips
Indikator
13 käufe
Version 1.0, Nov 2024
Windows, Mac
4.3
Bewertungen: 3

Beschreibung
Dieser Fair Value Gap (FVG) Indikator ist ein Werkzeug der technischen Analyse, das Händlern hilft, Preisungleichgewichte zu erkennen.
Funktionen:
- Sichtbarkeit von bullischen und/oder bärischen Gaps umschalten
- Farbkodierte Kästen zur einfachen Visualisierung anzeigen (Standard: grün für bullisch, rot für bärisch, gold für Mittelpunktslevel)
- Anpassbarer Rückblickzeitraum zur Reduzierung von Chart-Unordnung
- Konfigurierbare Kästchenverlängerungseinstellung (Offset) für bessere Visualisierung
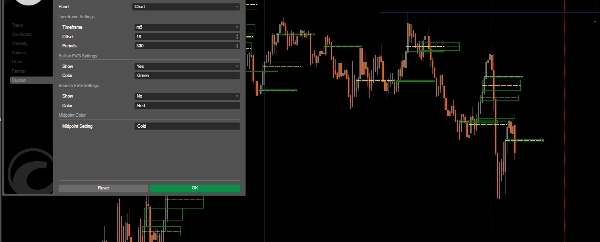
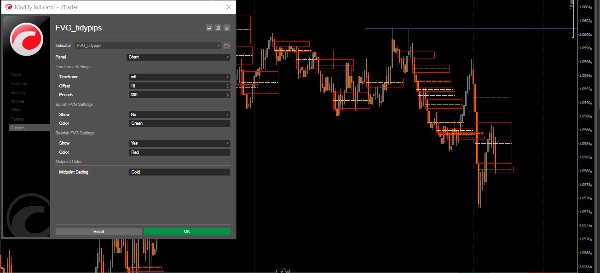
Parameter:
- Zeitrahmen: Wählen Sie Ihren bevorzugten Zeitrahmen zur Anzeige der FVGs
- Offset: Passen Sie die horizontale Verlängerung der FVG-Kästen an (3-500)
- Perioden: Legen Sie den Rückblickzeitraum für die historische FVG-Berechnung fest
- Bullische/Bärische FVGs anzeigen
- Farben: Passen Sie die Farben für bullische FVGs, bärische FVGs und Mittellinien an
Handelsanwendungen:
- Unterstützung und Widerstand: FVGs fungieren oft als starke Unterstützungs-/Widerstandsniveaus
- Preismagnete: Ungefüllte Gaps ziehen tendenziell die Kursbewegung an (DOL)
- Marktstruktur: Helfen, potenzielle Umkehrzonen und interessante Fortsetzungspunkte zu identifizieren
- Orderblock-Analyse: Institutionelle Handelszonen erkennen
Beste Anwendungspraxis:
- In Kombination mit anderen Werkzeugen der technischen Analyse verwenden.
- Höhere Zeitrahmen erzeugen bedeutendere FVGs, niedrigere Zeitrahmen-FVGs werden mit höherem Zeitrahmen-Richtungstrend verwendet
- Beobachten Sie, wie der Preis reagiert, wenn er zu FVG-Zonen zurückkehrt
- Achten Sie auf die Mittellinie, da sie oft als Preismagnet dient
Schauen Sie sich auch andere nützliche Indikatoren an, die ich veröffentlicht habe. Wenn Sie diesen oder einen meiner anderen Indikatoren hilfreich finden, erwägen Sie bitte, meine Arbeit durch einen Kauf oder eine Spende zu unterstützen. Ihre Unterstützung hilft mir nicht nur, diese Werkzeuge weiterzuentwickeln und zu verbessern, sondern stellt auch sicher, dass ich weiterhin neue, wertvolle Indikatoren erstellen kann, um Ihr Handelserlebnis zu verbessern. Vielen Dank für Ihre fortwährende Unterstützung!
https://buymeacoffee.com/tidypips
Zusammenfassung
KI-Zusammenfassung
The FVG_tidypips indicator is a technical analysis tool designed to identify Fair Value Gaps (FVGs), which represent price imbalances on trading charts. It visually highlights bullish and bearish gaps using color-coded boxes—green for bullish, red for bearish, and gold for midpoint levels—facilitating quick recognition of potential support and resistance zones. Users can toggle the visibility of bullish and/or bearish gaps, adjust the lookback period to manage chart clutter, and configure the horizontal extension (offset) of the FVG boxes for clearer visualization.
Key parameters include selecting the timeframe for FVG display, setting the offset range (3–500), defining the lookback period for historical gap calculation, and customizing colors for different gap types and midpoint lines. The indicator supports trading applications such as identifying strong support/resistance levels, spotting price magnets where unfilled gaps attract price action, analyzing market structure for potential reversal or continuation zones, and detecting institutional order block areas.
Best practices recommend using this indicator alongside other technical tools, focusing on higher timeframes for more significant FVGs, and monitoring price reactions when revisiting FVG zones. The midpoint line is noted as an important price magnet. This tool is applicable across various markets, including commodities like gold (XAUUSD).
Indikatorprofil
Kundenbewertungen
4.3
Bewertungen: 3
5 | 33 % | |
4 | 67 % | |
3 | 0 % | |
2 | 0 % | |
1 | 0 % |
Kundenbewertungen
November 22, 2024
Good idea with limits for traders who use ICT or SMC concepts. It gives value around smart money style analysis, but zones still need manual validation. A good sample is 20 FVG or order block reactions, with messy 0.705 areas skipped. The zone is more convincing when structure and risk both make sense.
November 21, 2024
November 21, 2024
Small but practical edge for smart money style analysis. it adds structure around liquidity, gaps and market shifts, especially when used for mapping zones before entries. For SMC logic, I trust zones more when 0.5 mitigation, BOS and liquidity sweep line up. The zone is more convincing when structure and risk both make sense.
Diskussion
Häufig gestellte Fragen (FAQ)
Commodities
XAUUSD
Über den cTrader Store verfügbare Produkte, einschließlich Handelsbots, Indikatoren und Plugins, werden von externen Entwicklern bereitgestellt und nur zu Informations- und technischen Zugriffszwecken verfügbar gemacht. cTrader Store ist kein Broker und erbringt keine Anlageberatung, persönlichen Empfehlungen oder eine Garantie für zukünftige Performance.
Mehr von diesem Autor


![„Gaussian Channel [Iridio Capital]“-Logo](https://cdn.ctrader.com/image/webp/7c039209-5573-4a54-a072-f9528b503103_41960)


Preis
15
Verkäufe
4.62K
Kostenlose Installationen