

คำอธิบาย
เครื่องมือนี้ช่วยให้ผู้ใช้กำหนดกรอบเวลาสำหรับการวิเคราะห์ เช่น รายวัน และวางระดับสูงและต่ำบนแผนภูมิของพวกเขาพร้อมสี สไตล์ และความหนาที่ปรับแต่งได้ รองรับหลายวันก่อนหน้า ทำให้ง่ายต่อการระบุโซนการเคลื่อนไหวราคาที่สำคัญ ตัวบ่งชี้ยังมีป้ายกำกับที่เป็นทางเลือกเพื่อความชัดเจน ช่วยให้เทรดเดอร์ตัดสินใจอย่างมีข้อมูลโดยอิงจากข้อมูลราคาประวัติ Ideal สำหรับทั้งเทรดเดอร์มือใหม่และมืออาชีพ เครื่องมือนี้ช่วยเพิ่มการวิเคราะห์ตลาดและกลยุทธ์การเทรด
คุณสมบัติ
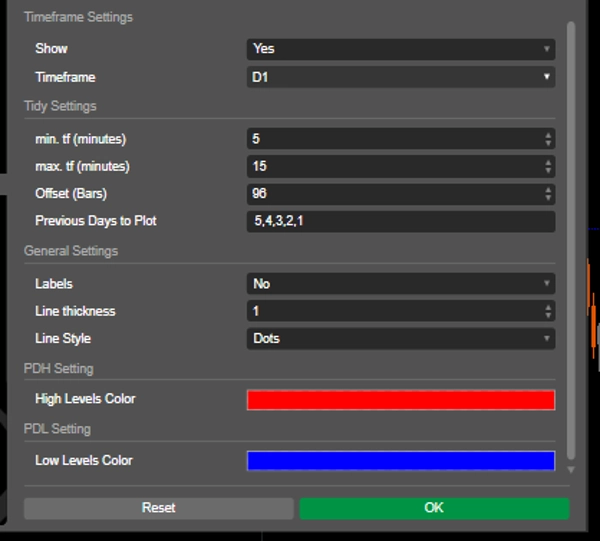
กรอบเวลาที่ปรับแต่งได้: ผู้ใช้สามารถเลือกกรอบเวลาที่เฉพาะเจาะจง (เช่น รายวัน) เพื่อวิเคราะห์ระดับสูงและต่ำก่อนหน้า ช่วยให้การแสดงผลเหมาะสมกับกลยุทธ์การเทรดของพวกเขา
หลายวันก่อนหน้า: ความสามารถในการวางระดับสูงและต่ำสำหรับหลายวันก่อนหน้าช่วยให้เห็นภาพรวมของโซนการเคลื่อนไหวราคาที่สำคัญอย่างครบถ้วน
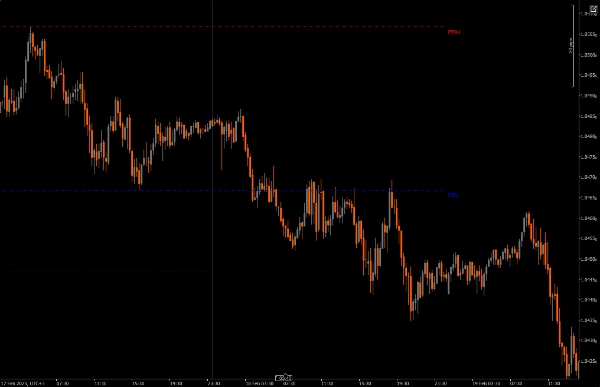
เส้นแนวโน้มแบบไดนามิก: ตัวบ่งชี้จะวาดเส้นแนวโน้มสำหรับระดับสูงและต่ำของวันก่อนหน้า ทำให้ง่ายต่อการระบุโซนที่อาจเกิดการกลับตัวได้อย่างรวดเร็ว
ตัวเลือกการติดป้าย: ผู้ใช้สามารถเปิดใช้งานป้ายเพื่อแสดงค่าระดับสูงและต่ำปัจจุบันบนแผนภูมิโดยตรง เพิ่มความชัดเจนและความเข้าใจ
การปรับแต่งภาพ: เทรดเดอร์สามารถปรับแต่งสีเส้น สไตล์ และความหนาให้เหมาะกับความชอบและเพิ่มความอ่านง่ายของแผนภูมิ
ข้อจำกัดกรอบเวลา: ตัวบ่งชี้จะทำงานเฉพาะภายในการตั้งค่ากรอบเวลาขั้นต่ำและสูงสุดที่กำหนดไว้ ช่วยลดความรกของแผนภูมิขณะเปลี่ยนกรอบเวลาอื่นๆ
ข้อควรทราบ
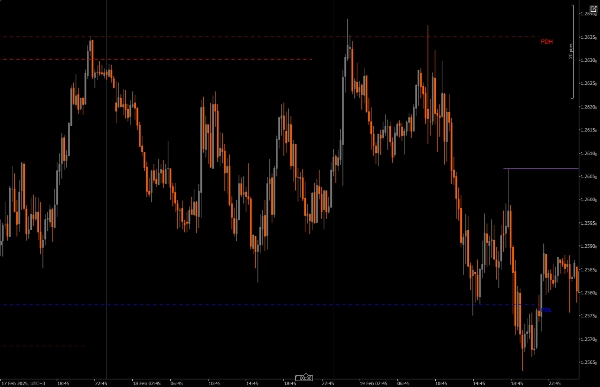
PDH หรือ PDL ในตลาดสามารถใช้เป็นจุดวาดบนสภาพคล่อง (DOL) หรือใช้เป็นกรอบสำหรับการกลับตัว
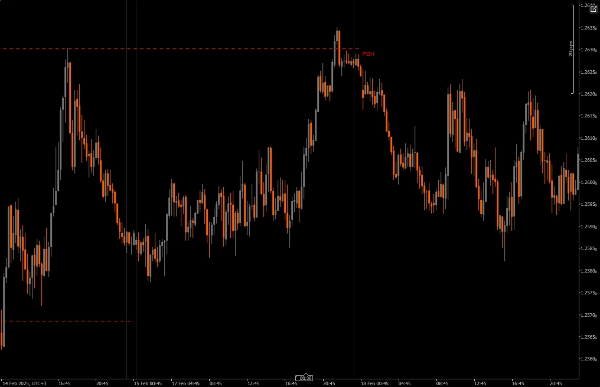
การกลับตัวสามารถกำหนดกรอบจาก PDH และ PDL เมื่อเกิดความล้มเหลวในการเลื่อนตำแหน่ง
เมื่อราคายอมรับชุด PD ด้านบนหรือล่าง และล้มเหลวในการเลื่อนผ่านระดับสูงหรือต่ำรายวัน เทียนถัดไปสามารถคาดการณ์ได้
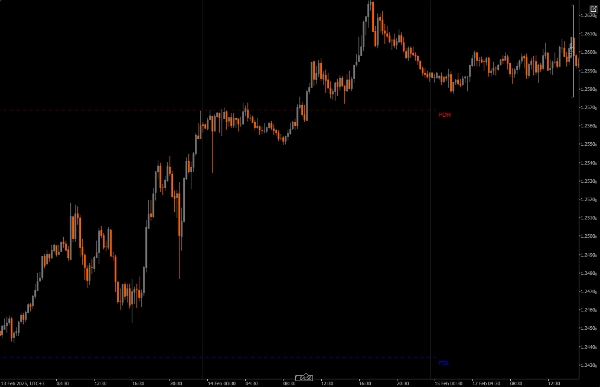
ราคามีแนวโน้มที่จะไปถึงระดับสูงหรือต่ำของวันก่อนหน้ามากกว่ากัน? เมื่อใช้ PDH PDL เป็นจุดวาดบนสภาพคล่อง (DOL)
การติดตั้ง: ดาวน์โหลดและติดตั้ง Daily Range Liquidity Zones (PDH PDL) บนแพลตฟอร์ม cAlgo ของคุณ
การตั้งค่า: เปิดการตั้งค่าตัวบ่งชี้และเลือกกรอบเวลาที่ต้องการสำหรับการวิเคราะห์ จำนวนวันก่อนหน้าที่จะวาง และปรับแต่งพารามิเตอร์ภาพเช่นสีเส้นและความหนา
การใช้ตัวบ่งชี้: ตัวบ่งชี้จะวางระดับสูงและต่ำของวันก่อนหน้าโดยอัตโนมัติบนแผนภูมิของคุณตามการตั้งค่าที่ระบุ
วิเคราะห์: สังเกตระดับที่วางไว้ขณะเทรด ใช้ระดับเหล่านี้เพื่อกำหนดกรอบการกลับตัวที่เป็นไปได้ และตัดสินใจเทรดอย่างมีข้อมูล
เครื่องมือแนะนำสำหรับใช้งานร่วมกัน
cTrader: แพลตฟอร์มพื้นฐานสำหรับ cAlgo ที่ให้สภาพแวดล้อมที่ราบรื่นสำหรับการใช้และปรับแต่งตัวบ่งชี้
เครื่องมือวิเคราะห์ทางเทคนิค: รวมตัวบ่งชี้นี้กับเครื่องมืออื่นๆ เช่น Fair Value Gaps (FVG) และ Reversal Pattern Indicators (CRT) เพื่อเพิ่มกลยุทธ์การเทรดและการวิเคราะห์ตลาดของคุณ
เครื่องมือบริหารความเสี่ยง: ใช้เครื่องคิดขนาดตำแหน่งและเครื่องมือหยุดขาดทุนเพื่อจัดการความเสี่ยงอย่างมีประสิทธิภาพขณะเทรดรอบระดับสูงและต่ำที่ระบุ
โดยการผสานรวม Daily Range Liquidity Zones (PDH PDL) กับเครื่องมือเหล่านี้ เทรดเดอร์สามารถเพิ่มการวิเคราะห์ตลาดและเพิ่มโอกาสความสำเร็จในการนำทางความซับซ้อนของการเคลื่อนไหวราคา
สรุป
รีวิวจากลูกค้า
5 | 100 % | |
4 | 0 % | |
3 | 0 % | |
2 | 0 % | |
1 | 0 % |


