
Description
*LES HEURES D'OUVERTURE SERONT DIFFÉRENTES SELON LES CLASSES D'ACTIFS
*LES VALEURS DE TEMPS PAR DÉFAUT SONT POUR NQ/ES/YM (CONTRATS À TERME)
*LA VALEUR DU TEMPS DOIT ÊTRE EN HEURE NORMALE DE L'EST (EST)
Caractéristiques principales :
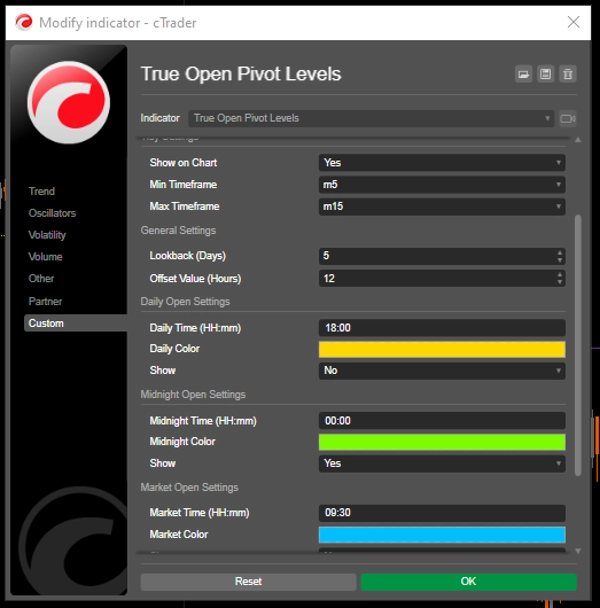
Niveaux de prix basés sur le temps
Trace des lignes de prix d'ouverture aux heures clés du marché
Tous les horaires sont synchronisés à l'heure normale de l'Est (EST)
Chaque période est codée par couleur pour une identification facile
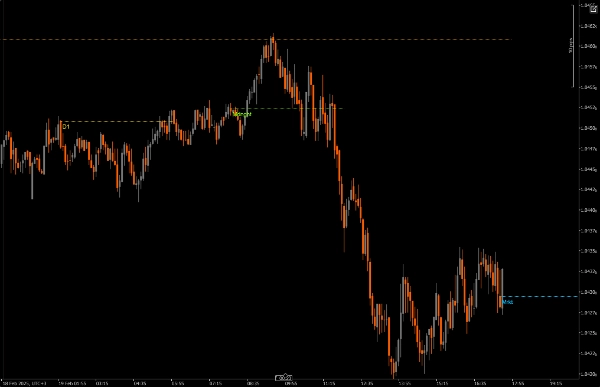
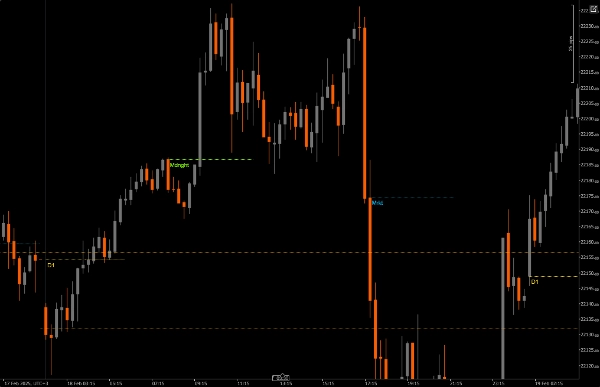
3 Marqueurs de session personnalisables :
Ouverture quotidienne (00:00 EST) - Or par défaut
Ouverture de minuit (04:00 EST) - Vert par défaut
Ouverture du marché (09:30 EST) - Bleu par défaut
Chaque session peut être activée/désactivée indépendamment
Personnalisation visuelle :
Épaisseur de ligne ajustable
Plusieurs styles de ligne (pleine, pointillée, tiretée)
Couleurs personnalisables pour chaque session
Étiquettes temporelles optionnelles affichant les heures EST
Décalage de ligne configurable jusqu'à 48 heures
Support flexible des intervalles de temps :
Définir les intervalles de temps minimum et maximum pour l'affichage
Évite l'encombrement du graphique sur des intervalles inappropriés
Optimisé pour les intervalles M5-M15
Paramètres temporels :
Tous les horaires sont en EST
Personnalisez les heures de session selon votre stratégie de trading
Ajustez la durée des lignes selon vos besoins d'analyse
Paramètres visuels :
Ajustez l'épaisseur des lignes pour la visibilité
Choisissez le style de ligne selon la clarté du graphique
Activez/désactivez les étiquettes selon les besoins
Personnalisez les couleurs pour correspondre au thème de votre graphique
Paramètres généraux :
Définir les intervalles de temps minimum/maximum
Ajuster la durée des lignes pour une analyse prolongée
Bonnes pratiques :
Commencez avec les paramètres par défaut et ajustez selon vos besoins
Utilisez des couleurs différentes pour chaque session pour une différenciation claire
Envisagez de réduire la durée des lignes sur les intervalles inférieurs pour éviter l'encombrement
Activez les étiquettes au départ pour comprendre le timing, désactivez-les si le graphique devient trop chargé
Adaptez les paramètres de l'indicateur à votre intervalle de trading
Cet indicateur est particulièrement utile pour :
Les day traders se concentrant sur les marchés américains
Les traders qui doivent suivre les ouvertures de session
Ceux qui tradent autour des événements majeurs du marché
Les traders analysant l'action des prix multi-sessions
Toute personne ayant besoin d'une référence visuelle claire pour les heures de marché EST
Résumé
Avis clients
5 | 100 % | |
4 | 0 % | |
3 | 0 % | |
2 | 0 % | |
1 | 0 % |


