Description
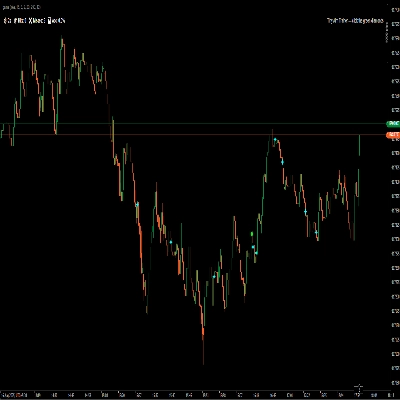
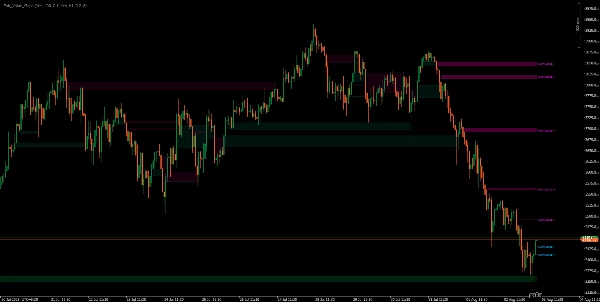
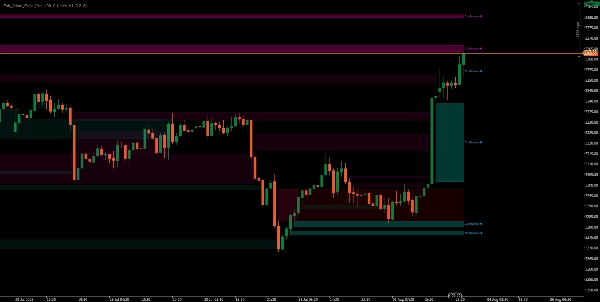
Débloquez des informations puissantes sur l'action des prix avec cet indicateur tout-en-un — détectez automatiquement les écarts de juste valeur (FVG) sur plusieurs périodes et mettez en évidence des zones de confluence puissantes directement sur votre graphique !
Caractéristiques principales :
- Détection FVG multi-périodes : Trace simultanément les écarts de juste valeur des périodes supérieures et inférieures, pour que vous puissiez voir d’un coup d’œil les déséquilibres clés et les zones de liquidité.
- Zones de confluence mises en évidence : Voyez instantanément où les FVG de différentes périodes se chevauchent — ce sont les « zones chaudes » que surveillent les traders institutionnels !
- Couleurs, opacité et taille des étiquettes FVG personnalisables : Ajustez l’affichage pour une visibilité et un style parfaits.
- Arrêt automatique du remplissage : Les zones FVG sont automatiquement supprimées une fois que le prix comble l’écart, gardant votre graphique propre et pertinent.
- Étiquettes sur le graphique : Chaque écart affiche une étiquette concise avec la période d’origine
- Design professionnel : Léger, efficace et entièrement compatible avec tout symbole ou période.
Parfait pour :
- Les traders SMC, ICT et orderflow
- Les traders day et swing qui veulent identifier les meilleures zones de déséquilibre
- Toute personne cherchant à ajouter des outils de confluence puissants à son flux de travail d’action des prix
**Ne tradez pas chaque FVG (déséquilibre) — tradez ceux qui comptent !**
Repérez et agissez sur les déséquilibres de liquidité les plus critiques où plusieurs périodes s’alignent.
Mes autres produits
- Institutional FVG Zones MTF with Confluence
- All-in-One Session Levels Suite
- MARKET_STRUCTURE BOS_CHoCH
- Multi_TF Candlestick Chart Overlay
- ICT Killzones & Macros
- ICT_SMC_ToolKit
- VWAP_MTF
- Traders Dynamic Index (TDI)
- Market_Session_Forex
Avertissement : Le trading comporte des risques, et les résultats passés ne garantissent pas les performances futures. Utilisez une gestion des risques appropriée, respectez les niveaux de stop-loss et tradez de manière responsable. Je ne suis pas responsable des pertes financières résultant de l’utilisation de ces algorithmes. Utilisez ces indicateurs pour votre confluence et réduisez le temps consacré au marquage de vos graphiques.
Résumé
Key features include customizable colors, opacity, and label sizes for FVG visualization, automatic removal of filled gaps to maintain chart clarity, and on-chart labels indicating the originating timeframe of each gap. The indicator is lightweight, efficient, and compatible with any symbol or timeframe.
This tool is suited for Smart Money Concepts (SMC), Inner Circle Trader (ICT), and order flow traders, as well as day and swing traders seeking to pinpoint critical imbalance zones. It supports markets including Forex, Indices, and Commodities. The indicator aims to assist traders in focusing on the most significant liquidity imbalances where multiple timeframes align, enhancing confluence in price action analysis.
Avis clients
5 | 100 % | |
4 | 0 % | |
3 | 0 % | |
2 | 0 % | |
1 | 0 % |