
PivotLevels
Indicatore
1 acquisti
Versione 1.0, Sep 2025
Windows, Mac
4.5
Recensioni: 2
Descrizione
Indicatore Pivot Points
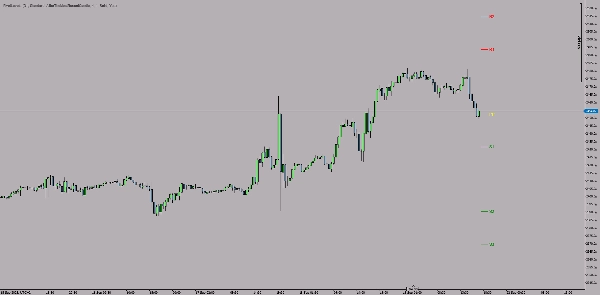
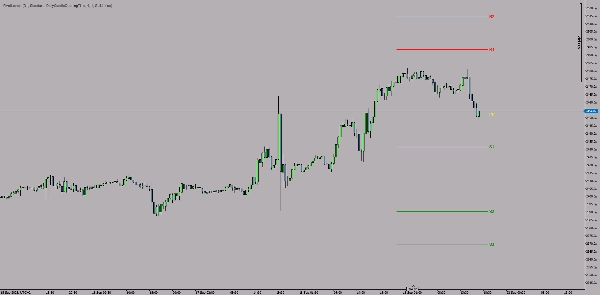
Il Pivot Points è un indicatore tecnico per la piattaforma cTrader che calcola automaticamente e visualizza i pivot point come linee di tendenza sul grafico.
Caratteristiche principali:
🎯 Tipi di Pivot:
- Pivot Points Standard
- Pivot Points di Fibonacci
- Pivot Points di Woodie
- Pivot Points di Camarilla
📊 Livelli:
- Punto Pivot Centrale (PP) - giallo
- Livelli di resistenza (R1, R2, R3) - rosso
- Livelli di supporto (S1, S2, S3) - verde
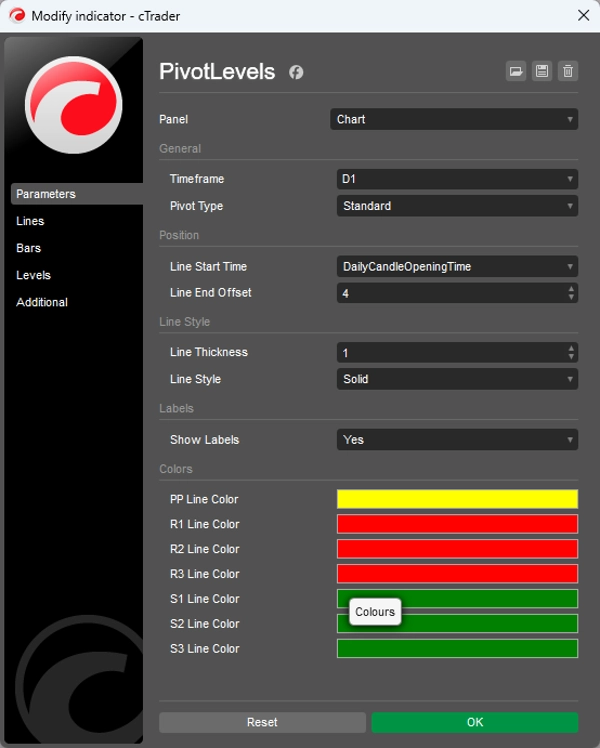
⚙️ Impostazioni personalizzabili:
- Intervallo temporale: Selezione giornaliera, settimanale o altro intervallo
- Stile della linea: Spessore (1-5) e tipo (solido, tratteggiato, ecc.)
- Posizionamento: Ora di inizio e lunghezza della linea
- Colori: Colore di ogni livello regolabile singolarmente
- Etichette: Attiva/disattiva etichette di testo
💡 Utilizzo:
L'indicatore calcola i livelli pivot basandosi sui valori di massimo, minimo, chiusura (e apertura) del periodo precedente (giorno/settimana), identificando aree chiave di supporto e resistenza per il prossimo periodo di trading.
Ideale per trader swing e day trader che applicano strategie basate su livelli tecnici.
Riepilogo
Riepilogo AI
PivotLevels is a technical indicator for the cTrader platform that automatically calculates and displays pivot points as trendlines on trading charts. It supports multiple pivot point calculation methods, including Standard, Fibonacci, Woodie, and Camarilla pivots. The indicator plots key levels such as the Central Pivot Point (PP) in yellow, resistance levels (R1, R2, R3) in red, and support levels (S1, S2, S3) in green.
Users can customize various settings, including the timeframe for pivot calculation (daily, weekly, or others), line style (thickness and type), line positioning (start time and length), colors for each level, and the option to toggle text labels on or off. The pivot levels are derived from the previous period’s high, low, close, and open prices, helping identify potential support and resistance zones for the upcoming trading period.
This indicator is suitable for traders who use technical levels in their strategies, particularly swing and day traders. It supports multiple markets such as forex, indices, commodities, cryptocurrencies, and stocks.
Profilo indicatore
Recensioni dei clienti
4.5
Recensioni: 2
5 | 50 % | |
4 | 50 % | |
3 | 0 % | |
2 | 0 % | |
1 | 0 % |
Recensioni dei clienti
September 30, 2025
The review gets easier when the decision feels less rushed, and The setup needs patience.
Discussioni
Domande frequenti
Prop
Forex
Indices
Commodities
Crypto
Stocks
I prodotti disponibili tramite cTrader Store, inclusi bot di trading, indicatori e plugin, sono forniti da sviluppatori terzi e resi disponibili esclusivamente a scopo informativo e di accesso tecnico. cTrader Store non è un broker e non fornisce consulenze in materia di investimento, raccomandazioni individualizzate o garanzie di risultati futuri.


Prezzo
Da 05/01/2025
14
Vendite