
Descrizione
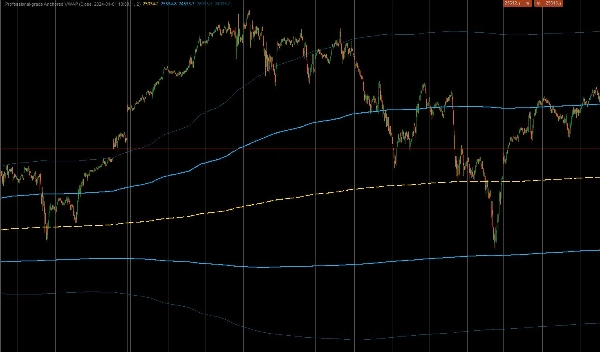
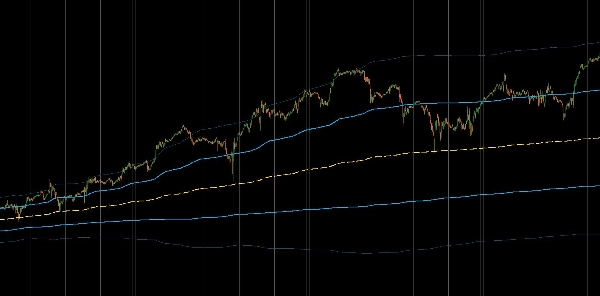
Questo è un indicatore personalizzato di livello professionale per cTrader progettato per calcolare il Prezzo Medio Ponderato per Volume Ancorato (AVWAP). A differenza degli indicatori VWAP standard che si azzerano quotidianamente, questo strumento consente ai trader di "ancorare" il calcolo a un evento specifico ad alto impatto—come una pubblicazione del CPI, un crollo del mercato o l'inizio di una tendenza—offrendo una vera visione istituzionale del prezzo medio da quel momento. Include anche Bande di Deviazione Standard Ponderate per Volume per identificare azioni di prezzo eccessivamente estese.
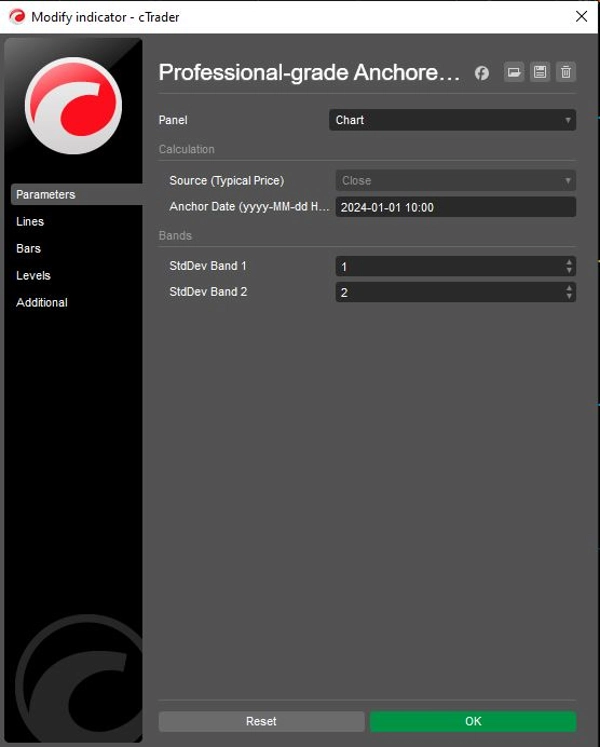
1. Calcolo di Base e Logica di Ancoraggio
- Ancoraggio di Precisione: L'indicatore utilizza una
Data di Ancoraggiodefinita dall'utente (ad esempio, "2024-01-01 10:00") per ignorare rigorosamente tutti i dati precedenti a quel minuto specifico. Questo garantisce che il prezzo medio rifletta solo i partecipanti coinvolti nella mossa o nel periodo di tempo specifico corrente. - Formula Istituzionale: Calcola il vero VWAP usando la somma cumulativa di (Prezzo × Volume) divisa per la somma cumulativa del Volume.
- Fonte del Prezzo Tipico: Per impostazione predefinita, utilizza il
"Prezzo Tipico" (High + Low + Close) / 3per i calcoli, che è il metodo standard usato dagli algoritmi istituzionali per determinare il valore equo, anche se può essere regolato su prezzi di apertura o chiusura.
2. Bande Avanzate di Volatilità
Per aiutare i trader a valutare gli estremi di mercato, l'indicatore calcola due serie di bande dinamiche basate su Varianza Ponderata per Volume:
- Banda 1 (La Zona di Valore): Impostata di default a 1.0 Deviazione Standard. Questa zona interna contiene tipicamente il "rumore" del valore equo del mercato. Una rottura da questa zona spesso segnala momentum.
- Banda 2 (La Zona Estrema): Impostata di default a 2.0 Deviazioni Standard. I prezzi che raggiungono questa banda esterna sono statisticamente sovraestesi, spesso segnalando potenziali opportunità di ritorno alla media (contrarian) o forte esaurimento della tendenza.
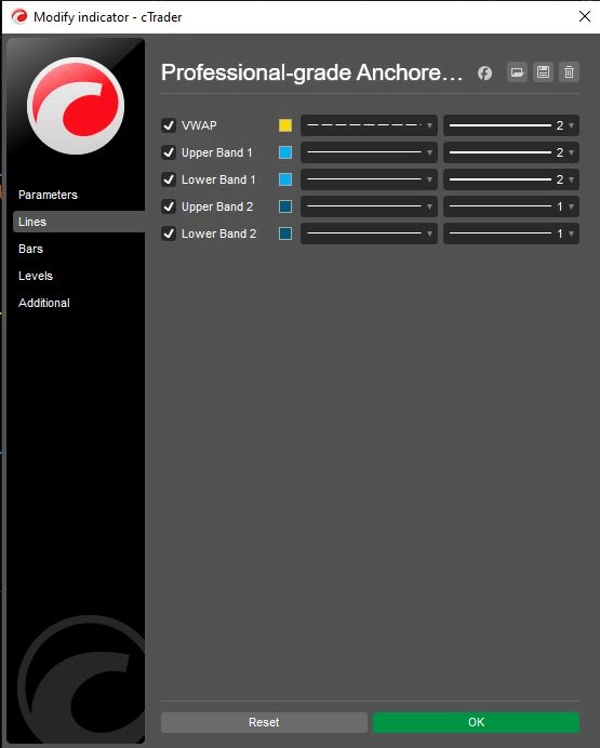
- Controllo Indipendente: Entrambe le bande includono singoli toggle
Show(ShowBand1,ShowBand2) e moltiplicatori di deviazione personalizzabili (Band1Dev,Band2Dev), permettendo grafici puliti adattati a specifiche strategie di volatilità.
3. Logica Visiva e Operativa
- Codifica Colore Strategica:
-
- Giallo (VWAP): Agisce come il "magnete" centrale o linea base della tendenza.
- Verde Lime (Banda 1): Rappresenta l'immediata area di supporto/resistenza "Zona di Valore".
- Rosso (Banda 2): Evidenzia deviazioni estreme dove aumenta la probabilità di inversione.
- Conservazione dello Stato: Il codice utilizza
IndicatorDataSeriesper variabili di stato interne (_cumVol,_cumPV), assicurando che i valori rimangano accurati durante i ricalcoli storici e gli aggiornamenti in tempo reale senza errori di repainting.
Sintesi del Flusso Logico
- Inizializza: Analizza la specifica stringa Data di Ancoraggio dell'utente in un oggetto DateTime di sistema.
- Filtra il Tempo: Per ogni barra, verifica se l'ora corrente è precedente all'Ancora. In tal caso, restituisce
NaN(non disegna nulla) e azzera i contatori cumulativi. - Accumulare Dati: Una volta raggiunto il tempo di Ancora, inizia ad aggiungere il Volume della barra corrente e (Prezzo × Volume) al totale in corso.
- Calcola VWAP: Dividi il Totale PV in corso per il Totale Volume in corso per ottenere la linea VWAP.
- Calcola la Varianza: Calcola la varianza ponderata per volume e ricava la Deviazione Standard.
- Traccia le Bande: Aggiungi/Sottrai la Deviazione calcolata dal VWAP per tracciare le bande Verde Lime e Rosse.
Riepilogo
Key features include:
- Precision anchoring to a user-specified date and time, ignoring data before that moment.
- Institutional VWAP calculation using cumulative (Price × Volume) divided by cumulative Volume.
- Default use of Typical Price ((High + Low + Close) / 3) for fair value, adjustable to Open or Close prices.
- Two dynamic volatility bands based on volume-weighted variance: Band 1 (1 standard deviation) representing the value zone, and Band 2 (2 standard deviations) indicating extreme price deviations.
- Independent toggles and customizable deviation multipliers for each band.
- Strategic color coding: yellow for VWAP, lime green for Band 1, and red for Band 2.
- Internal state preservation ensures accurate values during historical and real-time updates without repainting.
The indicator supports markets including Forex, indices, commodities, stocks, and cryptocurrencies, and is suitable for various symbols such as BTCUSD, EURUSD, GBPUSD, XAUUSD, and NAS100.
Recensioni dei clienti
5 | 50 % | |
4 | 50 % | |
3 | 0 % | |
2 | 0 % | |
1 | 0 % |


