
설명
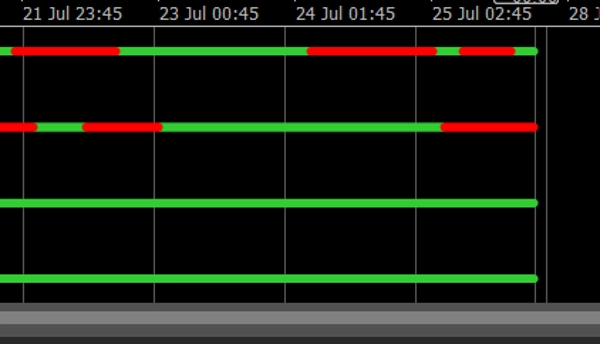
Multi Timeframe Trend Dots 은 cTrader용으로 제작된 강력하고 미니멀한 추세 지표입니다. 트레이더가 추세 방향을 시각적으로 추적할 수 있게 해주며, 최대 4개의 선택 가능한 시간 프레임에서 간단하지만 효과적인 색상 코드 점선으로 표시합니다.
✅ 초록색 = 상승 추세
✅ 빨간색 = 하락 추세
✅ 깔끔한 레이아웃의 단일 서브 윈도우
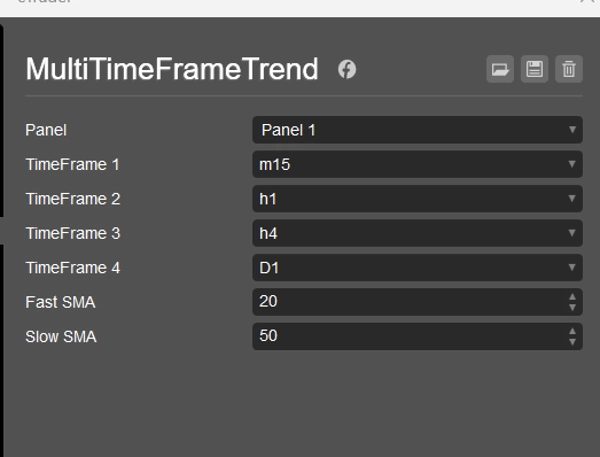
✅ 사용자 정의 가능한 SMA 빠른/느린 설정
✅ 모든 심볼과 시간 프레임에서 작동
당신이 스캘퍼, 일중 트레이더, 또는 스윙 트레이더이든, 이 지표는 다중 시간 프레임 정렬을 빠르게 확인할 수 있게 해주어 자신감 있는 진입이나 나쁜 설정 필터링에 이상적입니다.
💼 포함 내용:
- SMA 교차 기반 추세 논리
- 가독성을 고려한 4단계 점 배치
- 각 추세선 끝에 시간 프레임 라벨
- 모든 cTrader 버전과 완벽 호환
🎁 전략 구축이나 수동 거래에 완벽한 동반자입니다.
요약
지표 프로필
고객 리뷰
4.0
리뷰: 3
5 | 0 % | |
4 | 100 % | |
3 | 0 % | |
2 | 0 % | |
1 | 0 % |
고객 리뷰
August 10, 2025
July 30, 2025
The main upside is it brings another read without hijacking the plan, and one green trade proves nothing.
July 29, 2025
The reason it feels usable is the process slows down in a good way, and a 1R exit plan makes review easier.
상담
자주 묻는 질문(FAQ)
트레이딩 봇, 지표, 플러그인 등 cTrader Store에서 제공되는 상품은 제3자 개발자에 의해 제공되며, 이는 단순히 정보 및 기술적 접근을 목적으로 제공된 것입니다. cTrader Store는 중개인이 아니며, 투자 조언, 개인별 추천 또는 향후 성과에 대한 어떠한 보장도 제공하지 않습니다.
이 작성자의 상품 더 보기


가격
가입일 21/01/2025
3
판매