
说明
多时间框架ADX趋势点和箭头Multi-Timeframe ADX Trend Dots & Arrows 是一个专业的交易指标,适用于 cTrader,旨在利用 平均方向移动指数(ADX)识别多个时间框架中一致的市场趋势。
🔹 主要特点:
- ✅ 分析多达 4 个可自定义时间框架(M15,H1,H4,日线)。
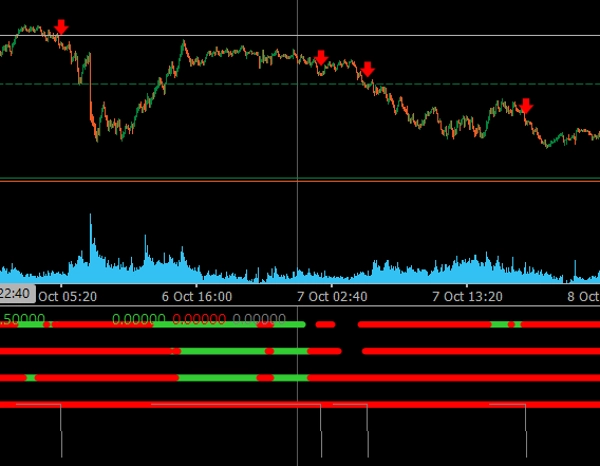
- ✅ 彩色点显示方向偏好(绿色=上升趋势,红色=下降趋势)。
- ✅ 当所有时间框架方向一致时,自动显示箭头。
- ✅ 连续柱过滤器减少错误或过早信号。
- ✅ 干净、现代的可视化,优化适用于暗色和亮色图表主题。
- ✅ 非常适合发现多时间框架确认和趋势延续点。
该指标非常适合希望 看到更大局面并且 仅在所有时间框架一致时入场的交易者,提供更强大且更可靠的交易设置。
摘要
AI 摘要
The ADXMultiframeIndicator is a trading indicator for the cTrader platform that identifies market trends by analyzing the Average Directional Movement Index (ADX) across multiple timeframes. It supports up to four customizable timeframes, including M15, H1, H4, and Daily. The indicator displays colored dots to indicate directional bias—green for uptrends and red for downtrends—and automatically shows arrows when all selected timeframes align in the same direction. A consecutive bars filter is included to reduce false or premature signals. The visualization is designed to be clear and modern, compatible with both dark and light chart themes. This tool assists traders in confirming multi-timeframe trends and identifying trend continuation points by highlighting when all timeframes agree, facilitating more informed trade entries. It is particularly useful for analyzing indices markets.
指标配置
客户评价
5.0
评价:2
5 | 100 % | |
4 | 0 % | |
3 | 0 % | |
2 | 0 % | |
1 | 0 % |
客户评价
October 28, 2025
the first signal should not decide the only input, but it can look better than it is during a lucky run.
讨论
常见问答
Indices
cTrader Store 提供的所有产品,包括交易机器人、指标和插件,均由第三方开发者提供,仅供信息参考和技术访问之用。cTrader Store 并非经纪商,不提供投资建议、个人推荐或任何未来业绩保证。
该作者的其他作品


!["[CB] Pivot Points Pro" 标识](https://cdn.ctrader.com/image/webp/43463c82-67b0-4f10-a4ba-901bba091d81_32594)


价格
注册日期 21/01/2025
3
销售