
Elliot Wave Impulse Pro
指标
3 购买
版本 1.0, Jan 2026
Windows 版、Mac 版
4.0
评价:2
说明
🌊 Elliott Wave Impulse Pro - cTrader 的自动波浪扫描仪
带有专业过滤器的自动艾略特波浪检测
基于艾略特波浪理论发现高概率交易设置——完全自动、精准,并配备智能质量过滤器!
🎯 这个指标有什么特别之处?
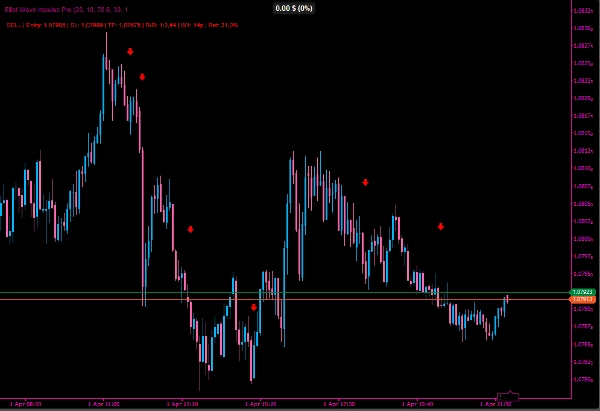
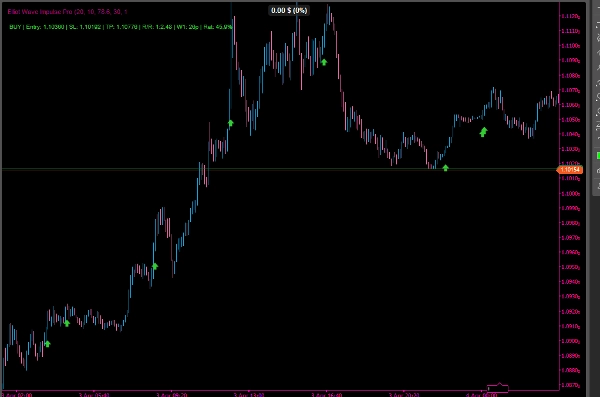
该 Elliott Wave Impulse Pro 持续分析市场并识别精确的波浪1-2-3冲击模式。当形成高质量设置且波浪3开始时,您将收到明确的买入或卖出信号,附带精确的入场、止损和止盈水平。
✨ 主要特点:
🔍 智能模式识别
- 自动检测看涨和看跌的艾略特波浪形态
- 精确识别波浪0、1、2及波浪3的预测
- 斐波那契回撤验证(38.2% - 78.6%)
- 仅显示结构已验证的模式
📊 独特的波浪质量评分(0-100分)
- 基于4个标准评估每个信号:回撤质量、风险/回报、波浪强度和平滑度
- 自动过滤掉弱的设置
- 仅高于您设定最低分数的高质量模式触发信号
🛡️ 专业过滤系统
- 支撑/阻力过滤器: 仅在重要的支撑/阻力区域发出信号
- 200均线趋势过滤器: 可选择顺势、逆势或两者
- 多时间框架确认: 更高时间框架必须确认信号
- 最低风险/回报比: 仅交易具有吸引人的风险回报比的机会
💎 包含风险管理
- 自动计算入场、止损和止盈
- 可调节的止盈倍数(默认: 1.618x 波浪1)
- 止损位于波浪2上下方/上方,带安全缓冲
- 显示每笔交易的风险/回报比
🎨 专业可视化
- 颜色编码的波浪线(波浪1、2、3使用不同颜色)
- 图表上直接显示买入/卖出箭头
- 可选:止盈/止损线、入场线、波浪3预测
- 清晰的信息面板,显示所有相关交易数据
- 颜色完全可自定义
🎛️ 超过30个可自定义参数
完全适应您的交易风格:
基础设置: 回溯周期,最小波浪1大小,波浪2回撤范围,最小风险/回报比
信号质量: 波浪质量评分开关,最低分数(0-100),支撑/阻力区域过滤,支撑/阻力回溯
趋势过滤器: 趋势对齐开关,均线周期,模式(两者/顺势/逆势)
多时间框架: 多时间框架确认,更高时间框架选择(H1、H4、日线、周线),高时间框架趋势均线周期
显示选项: 波浪线,止盈/止损线,入场线,波浪3预测,信息面板
止盈/止损设置: 止盈倍数(默认: 1.618 - 黄金比例!),止损缓冲(点数)
颜色: 所有颜色均可单独自定义
摘要
AI 摘要
Elliott Wave Impulse Pro is an automated indicator for the cTrader platform that detects Elliott Wave impulse patterns (Waves 0, 1, 2, and 3) in real time. It identifies bullish and bearish setups with professional filters, including Fibonacci retracement validation and support/resistance zone confirmation. The indicator provides precise buy or sell signals at the start of Wave 3, complete with calculated entry, stop-loss, and take-profit levels.
Key features include an intelligent pattern recognition system that displays only well-structured waves, and a unique Wave Quality Score (0-100) that evaluates signals based on retracement quality, risk/reward ratio, wave strength, and movement smoothness. Professional filters allow users to customize trend alignment using a 200-period moving average, multi-timeframe confirmation, and minimum risk/reward thresholds to ensure high-probability trades.
Risk management tools automatically calculate trade parameters with adjustable take-profit multipliers based on the golden ratio (1.618x Wave 1) and safety buffers for stop-loss placement. The indicator offers professional visualization with color-coded wave lines, trade arrows, optional display of TP/SL lines, and an info panel showing relevant trade data. Over 30 customizable parameters enable adaptation to various trading styles and preferences.
Supported markets include Forex, indices, commodities, stocks, and cryptocurrencies such as BTCUSD, EURUSD, GBPUSD, XAUUSD, and NAS100.
指标配置
客户评价
4.0
评价:2
5 | 0 % | |
4 | 100 % | |
3 | 0 % | |
2 | 0 % | |
1 | 0 % |
客户评价
January 30, 2026
the useful bit is the workflow feels calmer, and spread and slippage need a line in the notes.
January 29, 2026
讨论
常见问答
BTCUSD
Forex
Signal
Breakout
Indices
EURUSD
Commodities
GBPUSD
NZDUSD
Prop
Scalping
SMC
Crypto
Stocks
XAUUSD
NAS100
USDJPY
cTrader Store 提供的所有产品,包括交易机器人、指标和插件,均由第三方开发者提供,仅供信息参考和技术访问之用。cTrader Store 并非经纪商,不提供投资建议、个人推荐或任何未来业绩保证。


价格
注册日期 21/02/2025
466.3M
交易量
180.83K
盈利点数
22
销售
6.79K
免费安装