Descrição
Visualizador ICT Turtle Soup – com Confirmação MSS
Identifique configurações de reversão de alta probabilidade com base no conceito Inner Circle Trader (ICT) Turtle Soup. Este indicador detecta eventos de varredura de liquidez — momentos em que o preço rompe brevemente uma máxima ou mínima importante, aciona ordens de stop em espera e então recua — sinalizando uma possível entrada de reversão.
Ao contrário dos indicadores básicos de varredura, esta ferramenta adiciona uma pilha completa de confirmação com cinco filtros, incluindo um filtro opcional de Mudança na Estrutura de Mercado (MSS) que atrasa o sinal até que a estrutura de preço realmente confirme a reversão. Isso significa que não há entradas prematuras na própria vela de varredura — a seta só dispara quando o mercado mostra sua intenção.
──────────────────────────────────────────
COMO FUNCIONA
──────────────────────────────────────────
Todos os cinco filtros devem ser aprovados simultaneamente para que um sinal apareça:
1. Varredura + Rejeição de Fechamento
A barra deve ultrapassar a máxima ou mínima das N barras por um número mínimo de pips (configurável) e então fechar do outro lado. O fechamento deve recuperar uma proporção definida do alcance total da barra, confirmando que o rompimento foi um movimento falso e não um rompimento genuíno.
2. Nível da Estrutura de Retrospectiva
O alvo da varredura é a máxima mais alta ou mínima mais baixa das N barras anteriores (padrão: 20). Aumente esse valor para mirar níveis principais de oscilação diários ou semanais; reduza para configurações intradiárias de curto prazo.
3. Filtro de Volatilidade ATR
O alcance da barra de varredura deve estar dentro de uma janela de volatilidade significativa definida por um multiplicador mínimo e máximo do ATR. Isso filtra varreduras pequenas no estilo doji, bem como velas explosivas fora do padrão que não oferecem oportunidade realista de negociação.
4. Filtro de Sessão (Kill Zones)
Os sinais são válidos apenas durante a Kill Zone de Londres (padrão: 07:00–11:00 UTC) ou a Kill Zone de Nova York (padrão: 13:00–17:00 UTC). Configurações ICT ocorrendo fora dessas janelas de alta liquidez têm uma vantagem estatística significativamente menor.
5. MSS – Confirmação de Mudança na Estrutura de Mercado
Após uma varredura válida, o indicador espera até N barras (padrão: 5) por uma vela de confirmação:
• Sinal de venda: uma barra subsequente forma uma Máxima Inferior (máxima abaixo da máxima da barra de varredura) e fecha em baixa (fechamento abaixo da abertura).
• Sinal de compra: uma barra subsequente forma uma Mínima Superior (mínima acima da mínima da barra de varredura) e fecha em alta (fechamento acima da abertura).
Se nenhuma confirmação aparecer dentro da janela permitida, a configuração pendente é automaticamente descartada e quaisquer marcadores temporários são removidos.
──────────────────────────────────────────
SAÍDA VISUAL
──────────────────────────────────────────
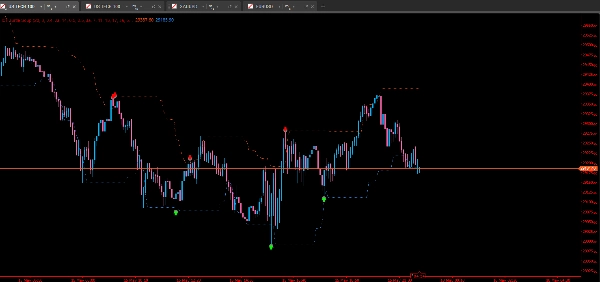
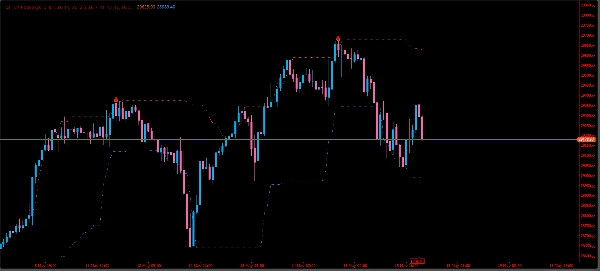
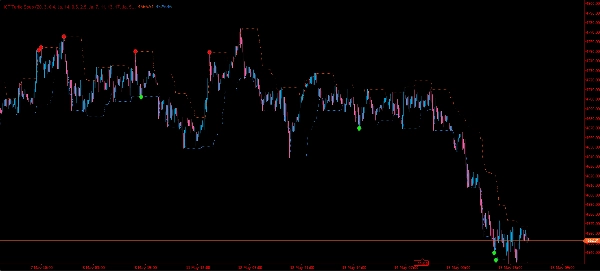
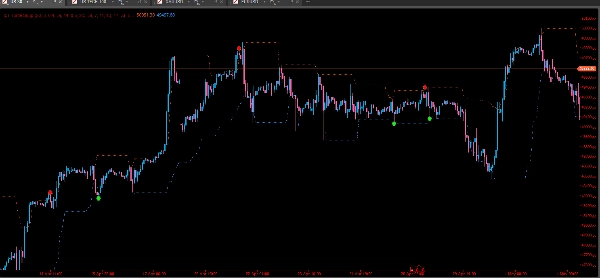
- Seta de venda (vermelha, para baixo) — desenhada na barra de varredura quando um MSS de venda é confirmado.
- Seta de compra (lima, para cima) — desenhada na barra de varredura quando um MSS de compra é confirmado.
- Marcador de varredura (ponto cinza) — aparece imediatamente em uma vela de varredura válida, antes da confirmação MSS. Use isso como um aviso antecipado para se preparar para uma possível entrada.
- Linha da Máxima Mais Alta (OrangeRed, pontilhada) — máxima estrutural rolante das N barras.
- Linha da Mínima Mais Baixa (DodgerBlue, pontilhada) — mínima estrutural rolante das N barras.
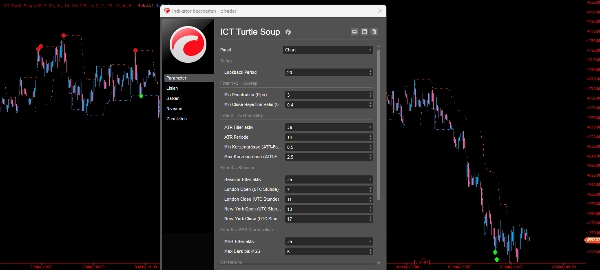
Todas as cores, distâncias das setas e visibilidade dos marcadores são totalmente personalizáveis nas configurações.
──────────────────────────────────────────
USO RECOMENDADO
──────────────────────────────────────────
- Prazo: M15 a H1 funciona melhor para negociação na kill-zone. H4 e Diário podem ser usados para confluência em prazos maiores.
- Instrumentos: Otimizado para os principais pares Forex, mas funciona em índices, commodities e criptomoedas.
- Horários das sessões: Todos os horários estão em UTC. Ajuste as horas da kill zone se seu corretor usar um deslocamento de horário de servidor diferente.
- Janela MSS: Comece com MaxMssBars = 5. Reduza para 2–3 em prazos menores para confirmação mais rápida e precisa.
- Fatores ATR: Aumente ligeiramente o fator máximo em instrumentos com maior volatilidade natural (ex.: Ouro, NAS100).
- O ponto cinza da varredura é seu alerta para observar — a seta colorida é sua confirmação para agir.
──────────────────────────────────────────
NOTAS
──────────────────────────────────────────
- Sem repintura: os sinais são avaliados apenas em barras fechadas. A barra ao vivo nunca é usada para detecção de varredura.
Resumo
Visual outputs include colored arrows indicating confirmed long (buy) or short (sell) signals, gray dots marking initial sweep candles, and dotted lines showing rolling highest highs and lowest lows over a configurable lookback period. The indicator is optimized for Forex majors but also applicable to indices, commodities, and cryptocurrencies. It works best on 15-minute to 1-hour timeframes during London and New York kill zones, with adjustable parameters for volatility and confirmation windows. Signals are based on closed bars only, ensuring no repainting. All visual elements and filters are customizable to fit different trading styles and instruments.
Avaliações de clientes
5 | 100 % | |
4 | 0 % | |
3 | 0 % | |
2 | 0 % | |
1 | 0 % |