
Mô tả
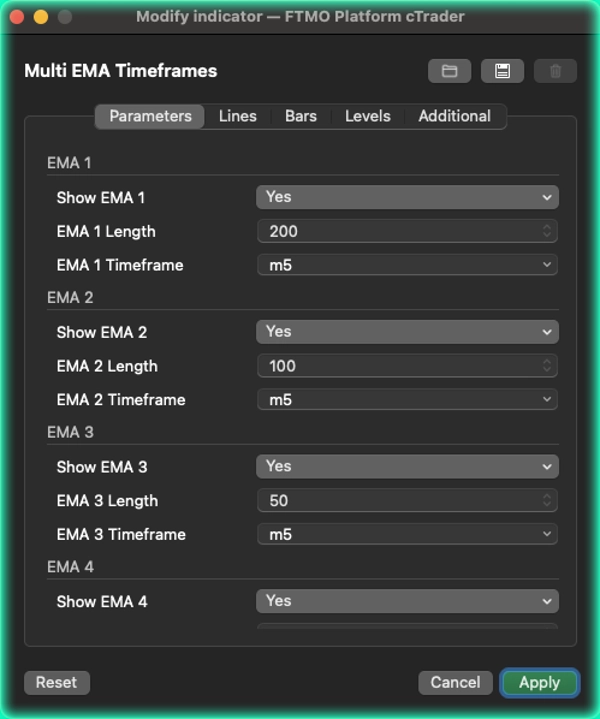
Multi EMA Timeframes bởi [BeyondTrading] Sai lầm phổ biến nhất mà các nhà giao dịch mắc phải với các đường trung bình động là chuyển đổi khung thời gian chỉ để kiểm tra vị trí của một EMA quan trọng. Multi EMA Timeframes loại bỏ hoàn toàn điều đó. Bạn ở lại trên khung thời gian làm việc của mình — khung 5 phút, 15 phút, 1 giờ — và bạn xác định chính xác EMA nào từ khung thời gian nào nên xuất hiện trên biểu đồ của bạn, ngay bây giờ, mà không cần di chuyển đâu cả.
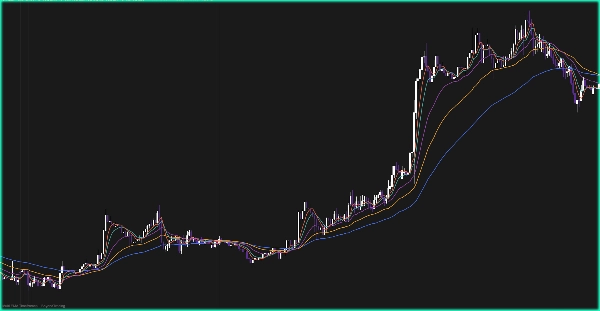
Bạn đang ở biểu đồ 5 phút và muốn xem EMA 200 từ khung giờ? Xong. Bạn cũng muốn EMA 50 từ khung 15 phút và EMA 20 từ khung thời gian hiện tại hiển thị cạnh nhau? Cũng xong. Mỗi trong năm EMA được cấu hình hoàn toàn độc lập: chu kỳ riêng, khung thời gian nguồn riêng, màu sắc riêng và công tắc bật/tắt riêng.
Điều này đặc biệt mạnh mẽ cho các thiết lập hội tụ. Khi giá trên khung thời gian vào lệnh của bạn tiếp cận một EMA thuộc khung thời gian cao hơn nhiều, mức đó mang trọng lượng cấu trúc thực sự. Việc nhìn thấy nó trực tiếp trên biểu đồ của bạn — không cần chuyển tab, không phải đoán giá trị chính xác — thay đổi cách bạn tương tác với các vùng quan trọng đó.
Hai chế độ hiển thị cho phép bạn kiểm soát cách các đường được vẽ. Chế độ Step đóng băng mỗi EMA tại thanh nguồn đã đóng hoàn toàn cuối cùng, vì vậy giá trị không bao giờ thay đổi cho đến khi thanh khung thời gian cao hơn đóng lại — không có việc vẽ lại, hoàn toàn đáng tin cậy cho các quyết định giao dịch trực tiếp. Chế độ Smooth nội suy liên tục giữa các thanh nguồn để có hình ảnh sạch hơn, phù hợp hơn cho phân tích và xem lại.
Điều làm nó khác biệt Hầu hết các chỉ báo multi-EMA tính toán mọi thứ trên khung thời gian hiện tại của biểu đồ. Ở đây, mỗi EMA thực sự được lấy từ khung thời gian độc lập riêng của nó. Bạn không phải ước lượng — bạn đang đọc EMA thực sự mà các nhà giao dịch trên khung thời gian đó thực sự thấy.
Tính năng
- Tối đa 5 EMA hoàn toàn độc lập, mỗi EMA có khung thời gian và chu kỳ riêng
- Ở lại trên bất kỳ khung thời gian biểu đồ nào trong khi đọc EMA từ bất kỳ khung thời gian nào khác
- Chế độ Step: giá trị khóa tại các thanh nguồn đã đóng, không vẽ lại
- Chế độ Smooth: nội suy tuyến tính cho chuyển đổi hình ảnh mượt mà
- Công tắc hiển thị/ẩn cho từng EMA để giữ biểu đồ của bạn luôn sạch sẽ
Tóm tắt
Đánh giá của khách hàng
5 | 50 % | |
4 | 50 % | |
3 | 0 % | |
2 | 0 % | |
1 | 0 % |


![Logo "[CB] Pivot Points Pro"](https://cdn.ctrader.com/image/webp/43463c82-67b0-4f10-a4ba-901bba091d81_32594)


