
CCI - With Arrows and 40 80 EMA Logic_noSourceCode
Indicador
2 compras
Versión 1.0, Feb 2025
Windows, Mac
5.0
Valoraciones: 1
Descripción
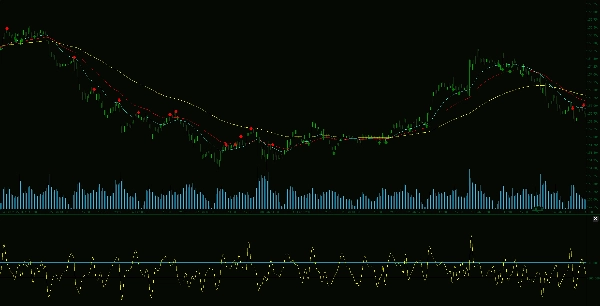
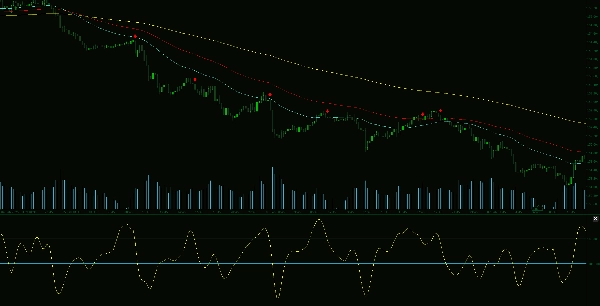
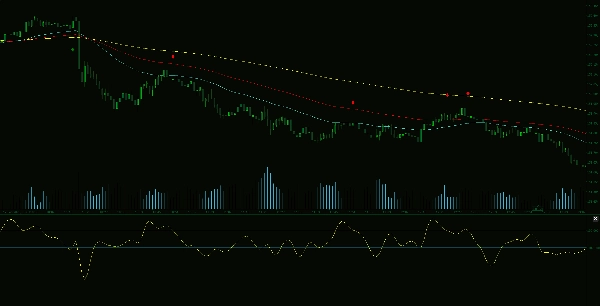
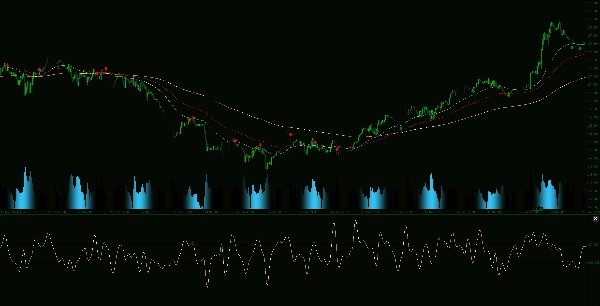
El Indicador Avanzado CCI y EMA es una herramienta de trading poderosa que mejora el análisis de tendencias combinando el Índice de Canal de Mercancías (CCI) con la lógica EMA de 40 y 80. Este enfoque sofisticado genera flechas que indican movimientos potenciales de precios, ayudando a los traders a identificar oportunidades de trading de alta probabilidad.
Características clave:
Resumen
Resumen de IA
The Advanced CCI & EMA Indicator integrates the Commodity Channel Index (CCI) with 40 and 80-period Exponential Moving Averages (EMAs) to enhance trend analysis and momentum detection. It generates clear buy and sell arrows on the chart, signaling potential price movements based on combined momentum and trend confirmation. Key features include CCI-based identification of overbought and oversold conditions, EMA logic to confirm trend direction and filter weak signals, and customizable settings to adapt to various trading strategies and timeframes. This indicator supports traders in aligning with prevailing market trends and improving timing by reducing false reversal signals. It is suitable for use on indices and commodities markets.
Perfil del indicador
Valoraciones de clientes
5.0
Valoraciones: 1
5 | 100 % | |
4 | 0 % | |
3 | 0 % | |
2 | 0 % | |
1 | 0 % |
Valoraciones de clientes
February 25, 2025
half size is enough at the start. Low quality setups lose some appeal.
Conversación
Preguntas frecuentes
Indices
Commodities
Los productos disponibles a través de cTrader Store, incluidos bots, indicadores y plugins para operar, son proporcionados por desarrolladores de terceros y están disponibles únicamente con fines informativos y de acceso técnico. cTrader Store no es un bróker, por lo que no proporciona asesoramiento de inversión, recomendaciones personales ni ninguna garantía de rentabilidad futura.


Precio
Desde 14/01/2025
55
Ventas
11.44K
Instalaciones gratis