
Standard Deviation Channel
インジケーター
2 購入済
バージョン 1.0、Oct 2025
Windows、Mac
5.0
レビュー: 1
説明
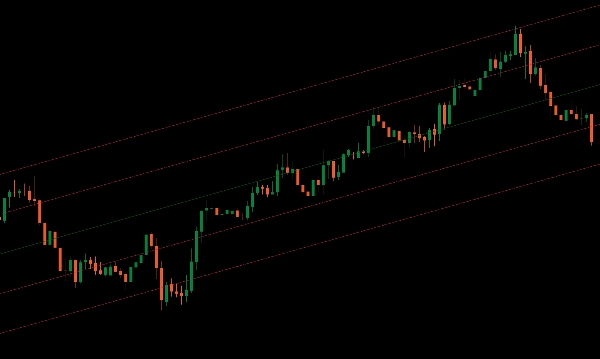
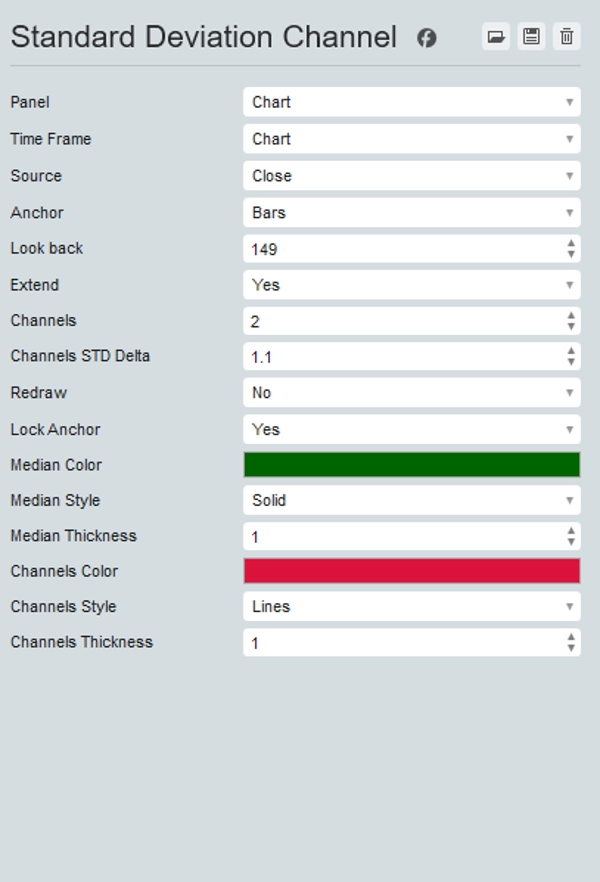
cTrader向けの標準偏差チャネルインジケーターをご紹介します。これは、市場のトレンドを正確に視覚化するために設計された強力なツールです。
このインジケーターは、指定した期間の中央値をチャートに表示し、価格変動の中心的な基準点を提供します。
さらに、標準偏差の倍数で上下のチャネルを任意の数だけ追加でき、価格の変動性や潜在的なブレイクアウトゾーンを明確に把握できます。
高度な分析機能を求めるトレーダーに最適な標準偏差チャネルインジケーターは、トレンドの方向や潜在的な反転ポイントを簡単に特定するのに役立ちます。
標準偏差チャネルでトレーディングツールキットをアップグレードし、優れた市場分析と意思決定を実現しましょう。
概要
インジケーターのプロフィール
カスタマーレビュー
5.0
レビュー: 1
5 | 100 % | |
4 | 0 % | |
3 | 0 % | |
2 | 0 % | |
1 | 0 % |
カスタマーレビュー
October 31, 2025
The product earns time when it makes the setup easier to question, and 3 sessions is a fair first sample.
ディスカッション
よくあるご質問
BTCUSD
Forex
Breakout
Indices
EURUSD
Commodities
GBPUSD
NZDUSD
Prop
Scalping
Crypto
Grid
Stocks
XAUUSD
NAS100
USDJPY
cTrader Storeで入手可能な取引ボット、インジケーター、プラグインなどの商品は、第三者の開発者が提供するものであり、情報と技術の取得のみを目的としてご利用いただけます。cTrader Storeはブローカーではなく、投資助言や個人的な推奨を行うことも、将来のパフォーマンスを保証することもありません。


![「[Hamster-Coder] Bollinger Bands」ロゴ](https://cdn.ctrader.com/image/webp/21d8e5d6-fb11-4bac-b9ee-cd05c2b76804_30327)


![「[Stellar Strategies] Market Session Ultimate」ロゴ](https://cdn.ctrader.com/image/webp/61ffd537-0125-4246-9e72-42eca1791d64_28232)


価格
登録日 25/09/2025
25
販売
331
無料インストール