
Descripción
Presentamos el indicador VWAP para cTrader, que trae toda la funcionalidad del Precio Medio Ponderado por Volumen de TradingView a tu plataforma de trading.
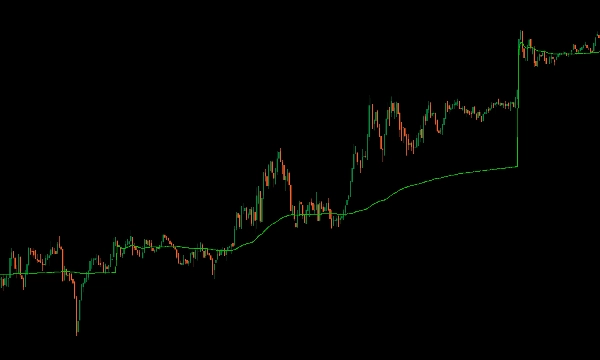
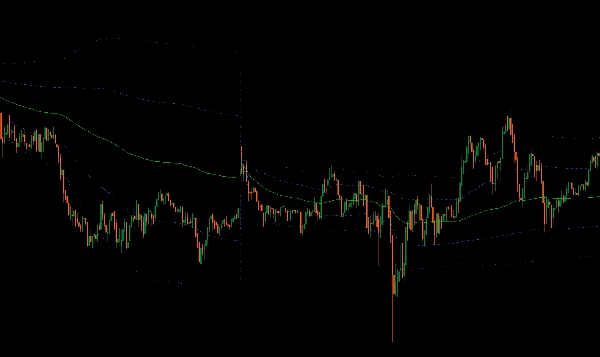
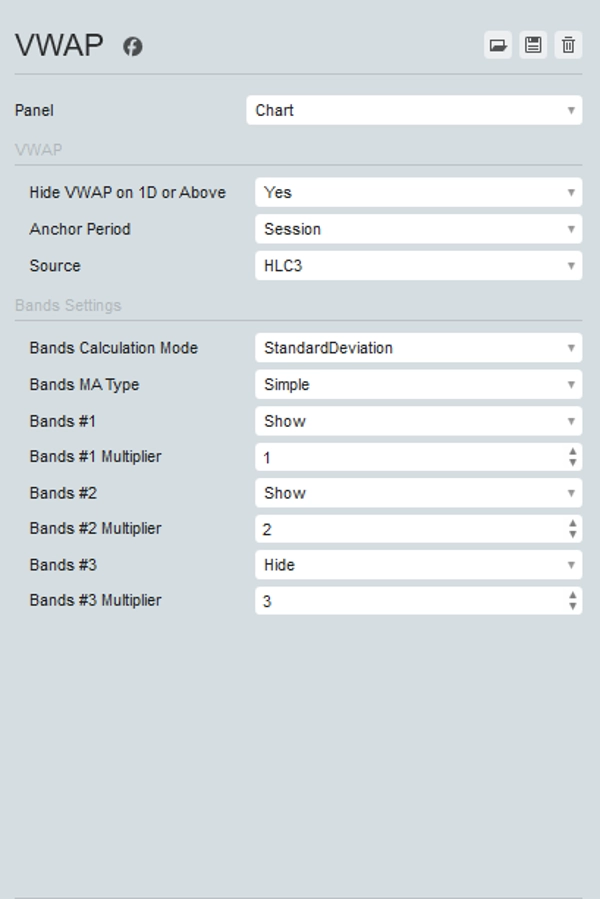
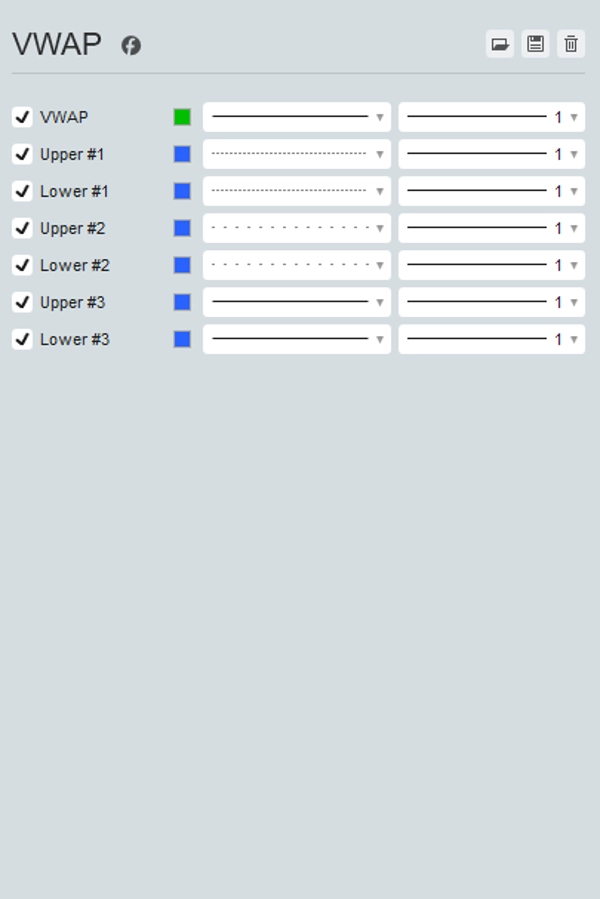
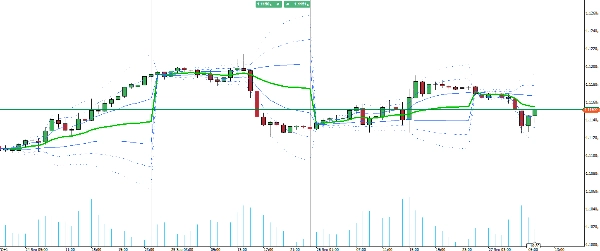
Esta herramienta completa te permite elegir tu período ancla (Sesión, Semana, Mes, Trimestre, Año) y seleccionar entre varias fuentes de precio, incluyendo Apertura, Máximo, Mínimo, Cierre, HL2, HLC3, OHLC4 y HLCC4. Además, puede mostrar hasta tres bandas superiores e inferiores de desviación estándar, proporcionando una vista completa de la distribución del precio.
El indicador VWAP se actualiza en tiempo real con datos de ticks, asegurando que tengas las perspectivas más precisas y oportunas para tus decisiones de trading. Eleva tu estrategia de trading con el versátil y potente indicador VWAP en cTrader.
Resumen
Valoraciones de clientes
5 | 67 % | |
4 | 33 % | |
3 | 0 % | |
2 | 0 % | |
1 | 0 % |


