
Descripción
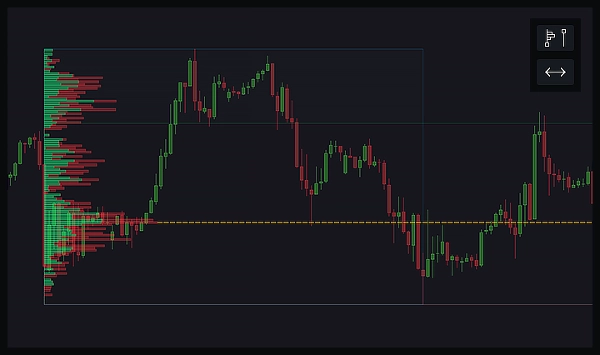
Un Perfil de Volumen de Rango Fijo es una herramienta que muestra cuánta actividad comercial ocurrió en diferentes niveles de precio dentro de un rango específico en un gráfico. Dibujas un rectángulo sobre el área que te interesa, y el perfil muestra barras horizontales que indican el volumen de operaciones en cada nivel de precio dentro de ese rango. Esto te ayuda a ver dónde ocurrió la mayor compra y venta, destacando niveles clave de precio que podrían ser importantes para tomar decisiones comerciales.
Los componentes clave del Perfil de Volumen de Rango Fijo incluyen:
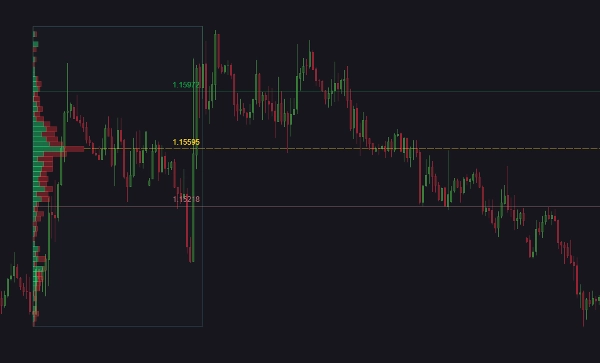
- Punto de Control (POC): El nivel de precio con el mayor volumen de operaciones dentro del rango seleccionado. Esto a menudo se considera un nivel significativo de soporte o resistencia porque refleja un precio donde tuvo lugar mucha actividad comercial.
- Valor Alto del Área (VAH): El límite superior del rango de precios donde ocurrió el 70% del volumen total de operaciones. Los precios por encima de este nivel se consideran menos negociados y potencialmente sobrevalorados.
- Valor Bajo del Área (VAL): El límite inferior del rango de precios donde ocurrió el 70% del volumen total de operaciones. Los precios por debajo de este nivel se consideran menos negociados y potencialmente subvalorados.
Estas líneas ayudan a los traders a identificar niveles de precio significativos que pueden actuar como soporte o resistencia. Al entender dónde se concentra la mayor parte del volumen de operaciones, los traders pueden tomar decisiones más informadas sobre posibles movimientos de precio, puntos de entrada y salida.
Por ejemplo, si el precio actual está cerca del POC, podría indicar un nivel fuerte de soporte o resistencia. Si el precio está dentro del área de valor, sugiere que está en un rango de valor justo, mientras que los precios fuera del área de valor podrían verse como puntos potenciales de ruptura o caída.
Lo que hace este indicador:
Este indicador mejora tu gráfico de trading con un análisis poderoso del perfil de volumen y alertas personalizables. Con dos botones intuitivos, puedes dibujar fácilmente perfiles de volumen de rango fijo y expandir o contraer niveles clave hasta el infinito. El perfil de volumen puede visualizarse en dos modos diferentes, barras totales o barras ascendentes y descendentes. Ajusta el número de niveles, la resolución de datos (Precisa o Rápida) y el tamaño del área de valor según tus necesidades.
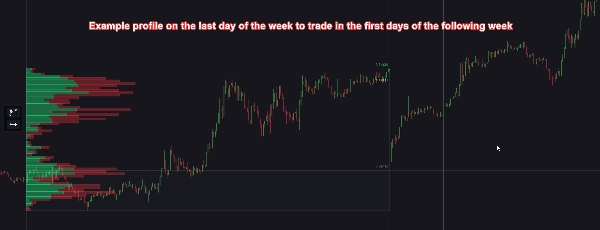
Los rangos magnéticos se actualizan automáticamente basándose en la última vela, asegurando que tu análisis esté siempre actualizado. También puedes personalizar la apariencia y el comportamiento del perfil y sus componentes, incluyendo las líneas POC, VAH y VAL. Se pueden configurar alertas para toques de precio, con opciones para activar acciones como iniciar o detener cBots, y cerrar posiciones. Las alertas pueden enviarse mediante sonido, ventanas emergentes de cTrader, mensajes de Telegram (con capturas de pantalla opcionales) y correos electrónicos.
Características:
- Perfil de Volumen de Rango Fijo: Dibuja un rectángulo para visualizar el perfil de volumen de un rango seleccionado.
- Expandir/Contraer Líneas: Extiende o contrae las líneas POC, VAH y VAL hasta el infinito.
- Modos de Perfil de Volumen: Elige entre volumen total o barras ascendentes y descendentes.
- Niveles y Resolución Personalizables: Selecciona el número de niveles y la resolución (Precisa o Rápida).
- Área de Valor Ajustable: Configura el tamaño del área de valor.
- Rangos Magnéticos: Redimensiona automáticamente los rangos para alinearlos con la última vela, actualizado cada 1–10 minutos o al cierre de la barra.
- Apariencia Personalizable: Cambia la posición, tamaño y estilo de los botones, líneas y barras de volumen.
- Alertas para Toques de Precio: Recibe notificaciones cuando el precio toque las líneas POC, VAH o VAL.
- Integración con cBot: Inicia o detén cBots basados en alertas.
- Gestión de Posiciones: Cierra posiciones cuando ocurren alertas, con opciones personalizables para cada línea (POC, VAH y VAL).
- Métodos de Alerta: Recibe alertas mediante sonido, ventanas emergentes de cTrader, mensajes de Telegram (con capturas opcionales) y correos electrónicos.
- Optimización de Rendimiento: Opción para eliminar automáticamente rangos pasados que no son visibles en el gráfico para mejorar el rendimiento.
- Control Global de Alertas: Activa o desactiva fácilmente todas las alertas de este indicador.
- Guía del Usuario: Puedes abrir fácilmente la guía del usuario de este indicador a través de un pequeño botón en el gráfico.
Resumen
The indicator offers two visualization modes: total volume or separate up and down volume bars. It features customizable settings for the number of volume levels, data resolution (Precise or Fast), and value area size. Magnetic ranges automatically update based on the latest candle to keep analysis current. Users can expand or contract POC, VAH, and VAL lines infinitely.
Alerts can be configured for price touches on these key levels, with notifications via sound, platform pop-ups, Telegram (including optional screenshots), and email. Alerts can trigger actions such as starting/stopping cBots or closing positions. The indicator also supports customizable appearance, performance optimization by auto-deleting out-of-view ranges, and global alert control. A user guide is accessible directly from the chart interface.
Valoraciones de clientes
5 | 67 % | |
4 | 0 % | |
3 | 33 % | |
2 | 0 % | |
1 | 0 % |


![Logotipo de "[Stellar Strategies] MARSI Signal Plotter"](https://cdn.ctrader.com/image/webp/7b2b8da6-8f8e-4646-8d4a-4710c516c01e_25567)


