
Описание
📈 Этот индикатор — инструмент, который помогает нам определить и визуализировать направление тренда на графике цены. 📊 Его работа основана на расчёте уровней тренда с использованием экспоненциальных скользящих средних и меры волатильности для определения зон, в которых ожидается движение цены. Ниже я подробно объясню, как он работает:
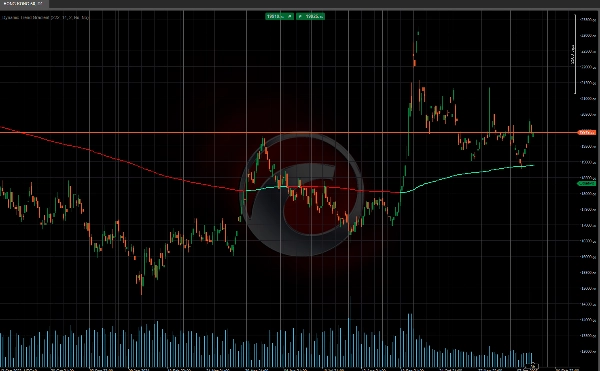
📐 Расчёт уровней тренда
Индикатор начинает с расчёта так называемого «базового уровня». Этот уровень получается путём усреднения двух экспоненциальных скользящих средних: одной краткосрочной (на основе длины, заданной пользователем, в данном случае 222) и одной долгосрочной (вдвое большей длины первой). Эти средние дают нам ориентир для общего тренда.
Далее рассчитывается волатильность с использованием стандартного отклонения цен закрытия, и это значение сглаживается дополнительной экспоненциальной скользящей средней. Сглаженная волатильность умножается на параметр, называемый «чувствительностью», что даёт нам верхние и нижние уровни вокруг базового уровня. Эти уровни выступают в роли полос тренда и помогают определить, находится ли цена выше или ниже тренда.
📉📈 Статус тренда
С рассчитанными уровнями индикатор оценивает статус тренда на рынке. Если цена находится выше базового уровня, предполагается бычий тренд 🐂, а если ниже — тренд медвежий 🐻. Если цена пересекает верхний или нижний уровни, индикатор меняет сигнал тренда, указывая на возможный разворот или смену рыночного импульса.
Этот инструмент идеально подходит для трейдеров, которые хотят опережать рыночные тренды! 🚀📉📈
Индикаторы Ctrader Store:
Dynamic Market Structure
Анализ точек поворота
Fibonacci Linear
Регрессия на нескольких таймфреймах
Multi-Level Candle Bias
Tracker
Auto Support and
Resistance Trend Lines
Сводка
Отзывы покупателей
5 | 0 % | |
4 | 100 % | |
3 | 0 % | |
2 | 0 % | |
1 | 0 % |


