
session indicator
Индикатор
7 покупки
Версия 1.0, May 2025
Windows, Mac
4.3
Отзывы: 3
Описание
Визуализируйте ключевые торговые сессии и уровни максимумов/минимумов с точностью
Индикатор торговых сессий выделяет самые важные торговые сессии — Лондон, Нью-Йорк и Токио — прямо на вашем графике. Независимо от того, являетесь ли вы скальпером или свинг-трейдером, знание моментов всплеска или снижения волатильности крайне важно. Этот инструмент обеспечивает это преимущество с ясностью.
✅ Основные функции:
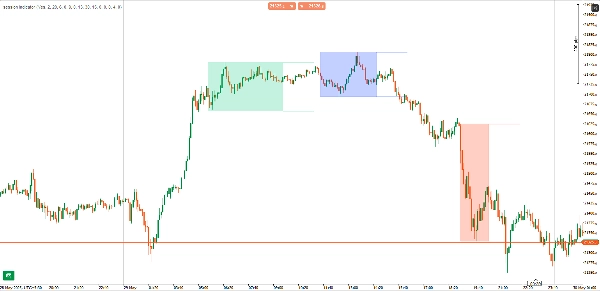
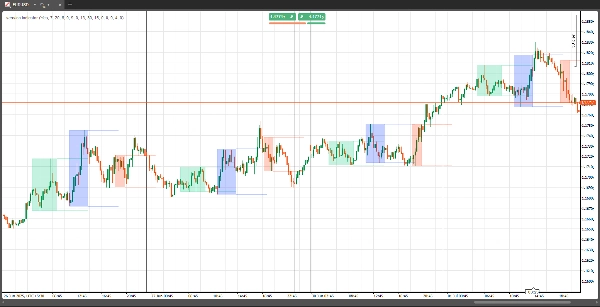
- Прямоугольники сессий: Визуально выделяйте каждую сессию с помощью опциональных затенённых блоков
- Линии максимумов/минимумов: Отображайте максимумы и минимумы сессий с настраиваемой длиной продолжения
- Исторический обзор: Просматривайте данные сессий за текущий день или любое количество предыдущих дней
- Полная настройка: Устанавливайте время начала/окончания сессий, включайте/выключайте прямоугольники и задавайте, насколько далеко должны простираться линии
- Поддержка нескольких таймфреймов: Работает на всех таймфреймах графика
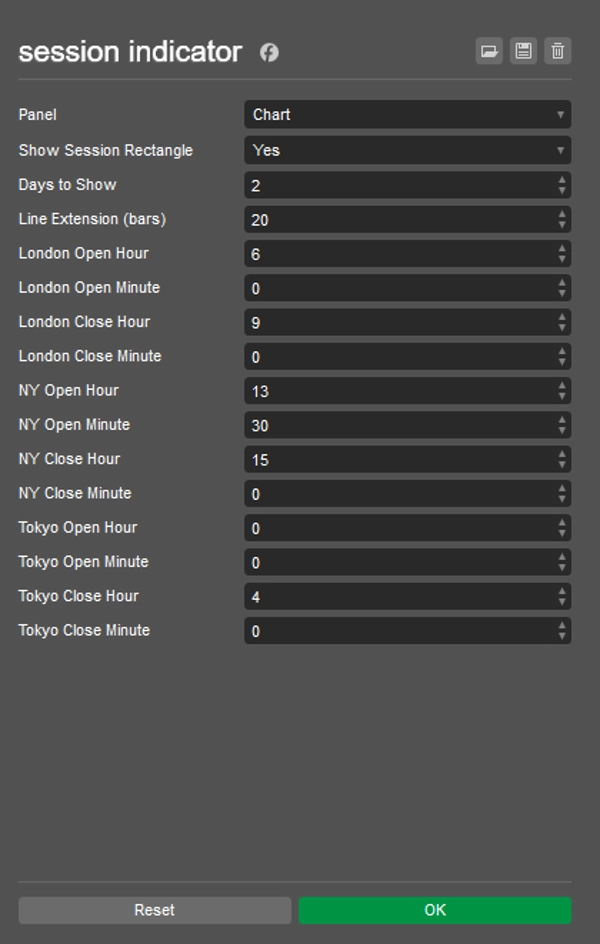
🔧 Параметры:
- Время сессий: Пользовательское время начала/окончания для Лондона, Нью-Йорка и Токио
- Показать прямоугольник: Включение/выключение затенённых блоков сессий
- Дни для отображения: Количество исторических дней для отображения данных сессий
- Количество баров продолжения линии: Управление тем, насколько далеко линии максимумов/минимумов сессий простираются на графике
🧠 Почему стоит использовать?
Понимание паттернов волатильности, основанных на сессиях, является краеугольным камнем институциональной торговли. Этот индикатор помогает вам:
- Точно входить и выходить вблизи ключевых зон ликвидности
- Определять максимумы и минимумы сессий для стратегий прорыва или разворота
- Визуально разделять пересечения сессий (например, Лондон–Нью-Йорк)
Сводка
ИИ-сводка
The Session Indicator is a charting tool designed to highlight key global trading sessions—London, New York, and Tokyo—directly on trading charts. It visually marks each session with optional shaded rectangles and plots session high and low price levels, with customizable line extension lengths. Users can view session data for the current day or multiple previous days, supporting analysis across various timeframes.
Key features include full customization of session start and end times, toggling of session rectangles, and control over how far high/low lines extend. The indicator works on all chart timeframes and helps traders identify volatility patterns associated with institutional trading sessions.
This tool aids in timing entries and exits around key liquidity zones, recognizing session highs and lows for breakout or reversal strategies, and visually distinguishing overlapping sessions such as London-New York. It supports markets including Forex, indices, and major symbols like NAS100. The indicator outputs visual signals based on market structure concepts and is suitable for traders employing reversal strategies.
Профиль индикатора
Категория индикатора
Структура рынка (SMC)
Тип вывода
Визуализация
Требования к данным
Только бары
Поддерживаемые сигналы
Разворот
Отзывы покупателей
4.3
Отзывы: 3
5 | 67 % | |
4 | 0 % | |
3 | 33 % | |
2 | 0 % | |
1 | 0 % |
Отзывы покупателей
June 2, 2025
Useful setup helper for traders who care about timing windows. It gives value around session timing, but the value depends on the trader's schedule. I would compare Asia range, London break and New York continuation before trusting it. The tool is most useful when it keeps the trader out of dead hours.
June 1, 2025
June 1, 2025
Decent trade support for session timing. it helps match setups with active market hours, especially when used for planning trades around active sessions. The session view is useful for London and New York, especially when checking the first 60 minutes. The tool is most useful when it keeps the trader out of dead hours.
Обсуждение
Частые вопросы
Prop
Forex
Indices
Fair Value Gap
SMC
NAS100
Продукты, доступные в cTrader Store, включая торговых ботов, индикаторы и плагины, предоставляются сторонними разработчиками и доступны исключительно в информационных и технических целях. cTrader Store не является брокером и не предоставляет инвестиционные консультации, персональные рекомендации или какие-либо гарантии будущей доходности.


Цена
С 30/05/2025
40
Продажи