


Descripción
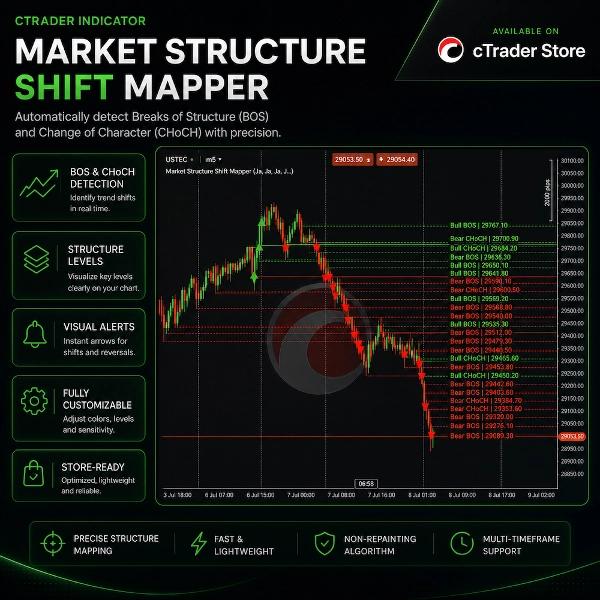
Market Structure Shift Mapper es un indicador visual de cTrader diseñado para identificar rupturas de estructura y cambios en la estructura del mercado directamente en su gráfico.
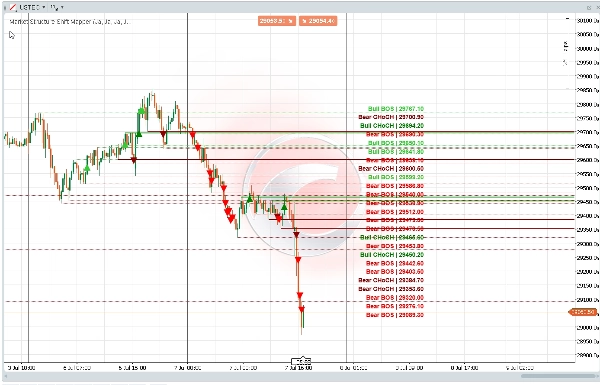
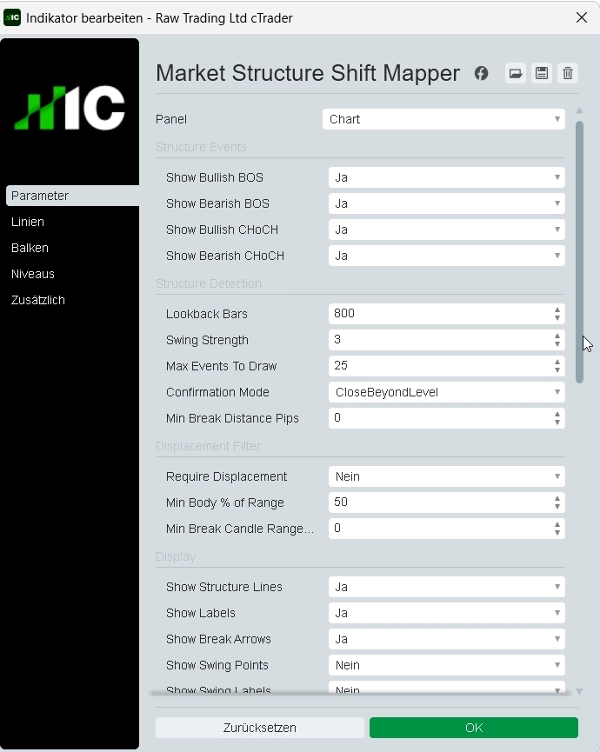
El indicador detecta máximos y mínimos oscilantes, luego marca eventos alcistas y bajistas de BOS o CHoCH cuando el precio rompe niveles de estructura relevantes. Puede mostrar líneas de estructura, flechas de ruptura y etiquetas limpias en el borde derecho con colocación apilada para reducir la superposición visual.
La herramienta está diseñada para análisis discrecional de la acción del precio, revisión de la estructura del mercado, preparación de gráficos basada en liquidez e investigación de backtesting.
Características principales:
- Detección de BOS alcista
- Detección de BOS bajista
- Detección de CHoCH alcista
- Detección de CHoCH bajista
- Detección de máximos y mínimos oscilantes
- Confirmación basada en cierre o mecha
- Filtro de desplazamiento opcional
- Flechas de ruptura de estructura
- Líneas de nivel de estructura
- Marcadores de puntos oscilantes opcionales
- Etiquetas apiladas en el borde derecho
- Protección contra superposición de etiquetas
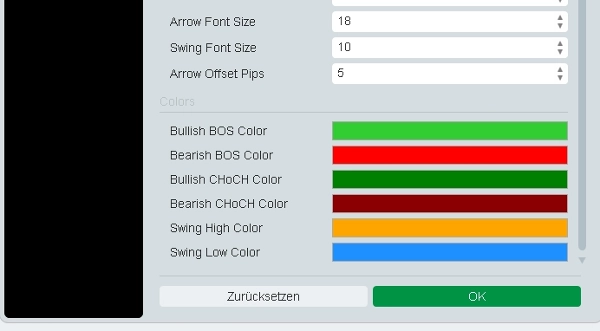
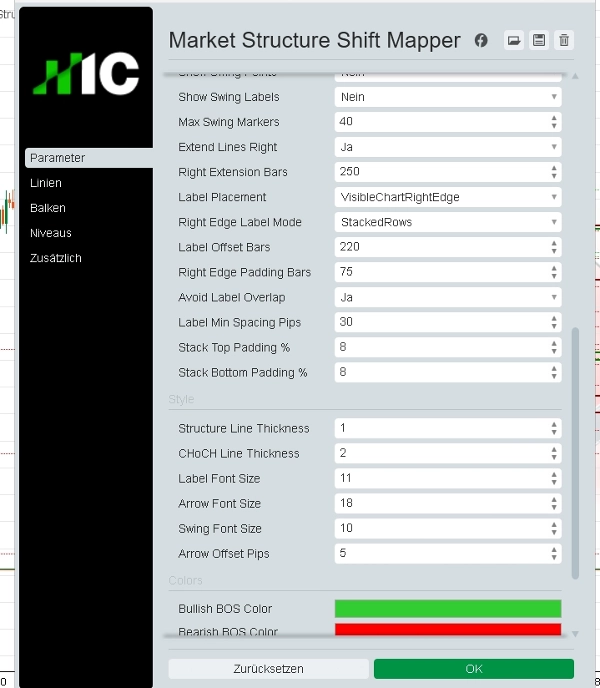
- Colores personalizados y configuraciones de línea
- Superposición limpia en el gráfico
- Indicador seguro para la tienda con derechos de acceso restringidos
Market Structure Shift Mapper no es un robot de trading. No ejecuta operaciones, modifica órdenes ni proporciona señales de compra/venta garantizadas. Es solo una herramienta de análisis visual y contexto de mercado.
El trading implica riesgos. Este indicador no ofrece asesoramiento financiero, recomendaciones de inversión, probabilidades estadísticas ni resultados garantizados de trading.
Resumen
Key features include:
- Detection of bullish and bearish BOS and CHoCH
- Swing high and low identification
- Close-based or wick-based confirmation options
- Optional displacement filtering
- Visual markers for structure breaks and swing points
- Customizable colors and line styles
- Clean chart overlay with label overlap protection
This tool supports discretionary price action analysis, market structure review, liquidity-based chart preparation, and backtesting research. It functions solely as a visual analysis aid and does not execute trades, modify orders, or provide trading signals or financial advice.
Valoraciones de clientes
5 | 100 % | |
4 | 0 % | |
3 | 0 % | |
2 | 0 % | |
1 | 0 % |

























