
الوصف
واحدة من أكبر الأخطاء التي يرتكبها المتداولون الجدد هي أنهم يحاولون إنشاء أكبر قدر ممكن من المعلومات على الرسم البياني عن طريق إضافة الكثير من المؤشرات والنتيجة هي رسم بياني مليء بالضوضاء مع خطوط وبيانات تعطي جميع أنواع الهراء التي تقدم للمتداول قصة متضاربة.
الإيجابيات:
- دقة مذهلة في اكتشاف الانعكاسات.
- مرئي وجذاب وسهل رؤية ظروف السوق.
- يمكن استخدامه كمؤشر تداول اتجاه أو مؤشر تداول عكس الاتجاه.
- نتائج اختبار خلفي قوية (~95% دقة على إشارات Extreme).
السلبيات:
- حتى مع ظروف "Extreme" المبالغ في الشراء و"Extreme" المبالغ في البيع، يمكن للمؤشر أحيانًا أن يجعلك تتداول في الاتجاه المعاكس لاتجاه قوي جدًا مما يسبب خسائر كبيرة قبل أن ينقلب السعر في النهاية.
- إشارات "Extreme" المبالغ في الشراء و"Extreme" المبالغ في البيع قد تكون قليلة ومتباعدة عند التداول على إطار زمني 15 دقيقة أو أعلى. لمواجهة ذلك، يُنصح بالتداول على الأقل بـ 8 أزواج رئيسية لتلقي إشارات Extreme بشكل متكرر.
كيفية استخدام انعكاسات الفوضى
يمكن إنشاء نظام بسيط وناجح باستخدام الفوضى عن طريق تحديد خطوط الدعم والمقاومة الأسبوعية واليومية وتداول عكس الاتجاه عند الارتدادات القادمة من تلك الخطوط باستخدام إشارات Extreme المبالغ في الشراء وExtreme المبالغ في البيع من فوضى الـ 15 دقيقة.
يتم توليد الإشارات كما يلي:
- يتحرك W%R السريع أولاً، يليه W%R البطيء.
- عندما يكون W%R السريع الفردي مبالغًا في البيع أو الشراء، يمكنك اقتناص هذه الانعكاسات.
- عندما يكون كل من W%R السريع والبطيء مبالغًا في البيع أو الشراء، فهذا يدل على أن السوق سيعكس بشكل كبير.
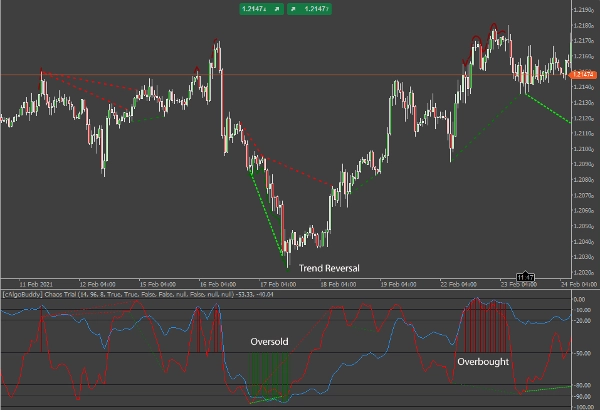
سيرسم المؤشر خطًا أحمر أو أخضر فوق القيعان أو القمم على مخطط السعر، وكذلك يرسم خطوطًا حمراء أو خضراء في منطقة المؤشر لتحديد حالات الإفراط في البيع أو الشراء القصوى. يمكنك تعطيل هذا في خيارات المؤشر.
كشف التباينات
نظرًا لأن W%R هو مذبذب، فإنه يمنحنا الفرصة لاكتشاف وتداول التباينات. هناك نوعان رئيسيان من التباين: عادي ومخفي.
- التباين العادي هو إشارة إلى انعكاس في اتجاه السعر.
- التباين المخفي هو إشارة إلى استمرار في اتجاه السعر.
داخل كل نوع رئيسي، هناك تصنيف ثانوي: هبوطي (سلبي) وصعودي (إيجابي).
- يحدث التباين الهبوطي عندما يتحرك المؤشر لأسفل بينما يرتفع السعر أو يظل ثابتًا.
- يحدث التباين الصعودي عندما يتحرك المؤشر لأعلى بينما ينخفض السعر أو يظل ثابتًا.
التباين العادي
التباين العادي ببساطة هو عندما:
- السعر يصنع قممًا أعلى بينما خط W%R السريع يصنع قممًا أدنى: احتمال بيع.
- السعر يصنع قيعانًا أدنى بينما خط W%R السريع يصنع قيعانًا أعلى: احتمال شراء.
في كلتا الحالتين، يبحث المتداول عن احتمال انعكاس في حركة السعر.
يُستخدم التباين العادي بشكل أفضل كمقارنة بين القمة أو القاع الحالي للحركة الحالية والقمة أو القاع السابق للحركة الحالية. مع التباين العادي، يضعف الاتجاه ويتغير شعور السوق في الاتجاه المعاكس. يمكن للمتداولين الاستعداد لتداول انعكاس أو ارتداد ملائم.
في انعكاسات الفوضى، يُظهر التباين العادي كما يلي:
- التباين العادي الصعودي – خط أخضر فاتح متقطع ضيق.
- التباين العادي الهبوطي – خط أحمر متقطع ضيق
ملاحظة: تظهر خطوط التباين عند فتح الشمعة التالية بعد تأكيد التباين.
التباين المخفي
التباين المخفي ببساطة هو عندما:
- خط W%R السريع يصنع قيعانًا أدنى بينما السعر يصنع قيعانًا أعلى: احتمال شراء.
- خط W%R السريع يصنع قممًا أعلى بينما السعر يصنع قممًا أدنى: احتمال بيع.
في كلتا الحالتين، يبحث المتداول عن احتمال استمرار في حركة السعر.
يُستخدم التباين المخفي بشكل أفضل لتقييم الأسعار المتعلقة بالاتجاه السائد. بعد ارتداد، غالبًا ما يستمر السعر في اتجاه الاتجاه نحو مستوى القمة أو القاع الأخير للحركة. مع التباين المخفي، قد يكون الاتجاه يضعف لكنه لم يكتمل بعد. كما هو موضح أدناه، تراجع السوق ربما بسبب جني الأرباح ويبدو أنه يستأنف الاتجاه الهبوطي.
في انعكاسات الفوضى، يُظهر التباين المخفي كما يلي:
- التباين المخفي الهبوطي – خط أخضر متقطع واسع
- التباين المخفي الصعودي – خط أحمر داكن متقطع واسع
التداول مع التباين
هذه ملاحظة سريعة للتحذير عند التداول مع التباين. كن على علم بأن السوق قد لا يتحرك في اتجاه إشارة التباين. من المهم فهم أن التباين هو إشارة إلى احتمال تغير أو استمرار في اتجاه السوق. من المهم مراقبة حركة السعر لتأكيد اتجاه السوق. أيضًا، لاحظ الاتجاه العام لمؤشر الفوضى، من خلال مقارنة خطوط المؤشر بالمستويات (0 للإفراط في الشراء، -100 للإفراط في البيع)
التنبيهات والإشعارات
الإشارات التي سيتم إرسالها هي بداية ونهاية الإفراط في الشراء/البيع القصوى، ذروة W%R البطيء في المواقع القصوى بالإضافة إلى جميع التباينات.
تنبيهات Telegram
بما أنك قد أعددت بوت وقناة في Telegram، فإن مؤشر انعكاسات الفوضى سيرسل لك رسائل للإشارات المؤكدة على زوج العملات.
مهم:
يرجى التأكد من ضبط المنطقة الزمنية بشكل صحيح على توقيتك المحلي (أسفل الزاوية اليمنى من التطبيق).
تنبيهات سطح المكتب
إذا اخترت نعم، فسيقوم مؤشر انعكاسات الفوضى بدفع إشعار رسالة على سطح المكتب الشخصي الخاص بك عند الإشارات المؤكدة.
تنبيهات البريد الإلكتروني
لكي تعمل هذه الوظيفة، يجب عليك أولاً تكوين cTrader الخاص بك ليتمكن من إرسال رسائل البريد الإلكتروني (الإعدادات-> البريد الإلكتروني).
الملخص
تقييمات العملاء
5 | 100 % | |
4 | 0 % | |
3 | 0 % | |
2 | 0 % | |
1 | 0 % |


