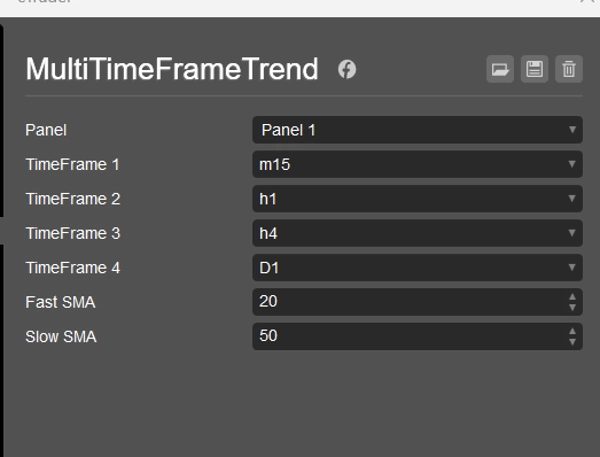
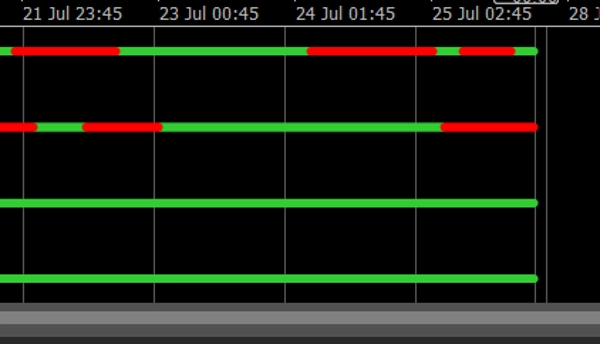
Corretores e props
Para empresas
00
Days
:
00
Hours
:
00
Minutes
:
00
Seconds
MultiTimeFrameTrend
Indicador
2 compras
Version 1.0, Jul 2025
Windows, Mac
Desde 21/01/2025
Vendas
3
Imagem carregada de "MultiTimeFrameTrend"Imagem carregada de "MultiTimeFrameTrend"

Multi Timeframe Trend Dots is a powerful and minimalist trend indicator built for cTrader. It allows traders to visually track trend direction across up to 4 selectable timeframes using simple but effective color-coded dot lines.

Green = Uptrend
Red = Downtrend
Clean layout in a single sub-window
Customizable SMA fast/slow settings
✅ Works on any symbol and timeframe

Whether you're a scalper, intraday trader, or swing trader, this indicator gives you a quick glance of multi-timeframe alignment — ideal for making confident entries or filtering out bad setups.

💼 Includes:

  • Trend logic based on SMA crossover
  • 4 level dot placement (adjusted for readability)
  • Timeframe labels at the end of each trend line
  • Fully compatible with all cTrader versions

🎁 Perfect companion for strategy building or manual trading.

0.0
Avaliações: 0
Avaliações de clientes
Ainda não há avaliações para este produto. Já o experimentou? Seja o primeiro a contar a outras pessoas!

Mais deste autor

Indicador
Indices
ADXMultiframeIndicator
Multi-Timeframe ADX Trend Dots & Arrows
Indicador
Indices
RSI
XAUUSD
+9
RsiMultiFrameOBOS
Multi-Timeframe Trend Dots RSI

Também poderá gostar de

Indicador
NAS100
RSI
NZDUSD
+18
QX Heatmap Scanner
Multi-timeframe heatmap scoring Direction, Strength & Volatility at a glance!
CRT Pattern Indicator
The CRT indicator helps ICT traders identify candlestick patterns, enhancing analysis of higher timeframe on lower
VegaXLR - Chart Patterns Alerts
Enhance your trading strategy with automated detection and alerts for key chart patterns.
E7 Volume Profile
E7 Volume Profile, more modern look and feel.
SpreadCalculator - BossFXTrader
Spread Calculator to calculate the difference between two prices or values.
Renko Moving Average Cross Indicator
The Renko Moving Average Cross indicator combines classic EMA crossover signals with Renko-filtered prices.
Indicador
Indices
RSI
Stocks
+5
REDGREENZONEREVERSAL
The Red & Green Zone Reversal Indicator detects overbought and oversold market conditions using Bollinger Bands and RSI.
Indicador
NAS100
XAUUSD
Commodities
+10
MARKET_STRUCTURE BOS_CHoCH
MarketStructurePro – Smart BOS/CHoCH
Indicador
Signal
USDJPY
On Balance Volume USD - Combined
See USD demand in one line—Composite OBV fuses six major FX pairs into a clear momentum gauge.
Indicador
NAS100
NZDUSD
Martingale
+26
MMXM Structure by Ludwig
MMXM Structure by LudwigICT – Professional Market Structure Mapping Tool
Indicador
Grid
NAS100
XAUUSD
+6
AutoFibRetracement
A powerful overlay tool designed to automatically plot Fibonacci retracement levels based on a custom window.