
Описание
✅ Обнаруживает точки разворота с высокой и низкой вероятностью с использованием продвинутой логики пивотов
✅ Полностью настраиваемые модули глубины, отклонения и отката
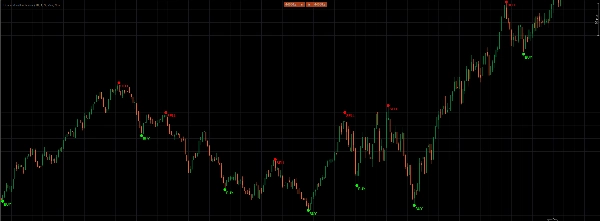
✅ Автоматически отображает четкие метки ПОКУПКА и ПРОДАЖА на графике
✅ Опциональные маркеры пивотов и выделения текущего бара для дополнительной наглядности
✅ Разработан для точного и уверенного определения ранних разворотов
Откройте для себя точную торговлю с помощью индикатора Покупка & Продажа: мощного сигнального движка на основе пивотов, который выявляет точки разворота с высокой и низкой вероятностью, используя настраиваемые параметры глубины, отклонения и отката. Настройте DepthEngine, DeviationEngine и BackstepEngine для тонкой настройки чувствительности, а затем позвольте индикатору автоматически отображать четкие метки «ПОКУПКА» и «ПРОДАЖА» — с дополнительными опциональными маркерами пивотов и текущего бара в ваших любимых цветах — чтобы вы больше никогда не пропустили разворот тренда! Торгуйте умнее, а не усерднее.
Сводка
Отзывы покупателей
5 | 33 % | |
4 | 67 % | |
3 | 0 % | |
2 | 0 % | |
1 | 0 % |


