
Описание
✅ Плавная линия тренда с изменением цвета, которая мгновенно адаптируется к направлению
✅ Опциональные стрелки вверх и вниз для четких сигналов смены тренда
✅ Фильтрует шум, чтобы выделить чистые, надежные переходы тренда
✅ Идеально подходит для следования за трендом, откатов и разворотов
✅ Полностью настраиваемый: период, чувствительность и отображение стрелок
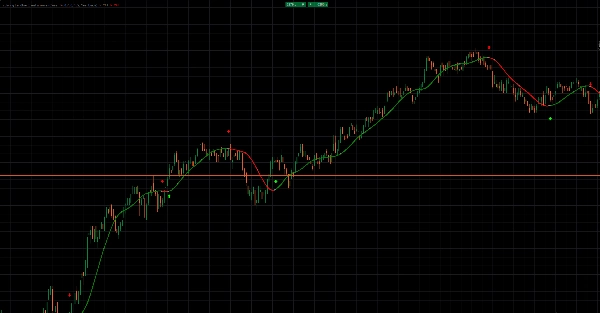
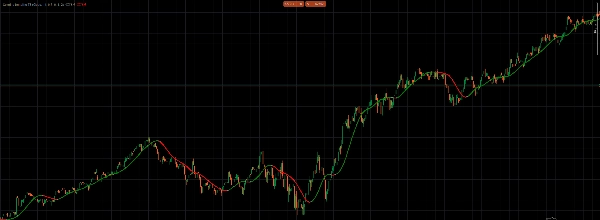
Линия тренда с цветовой индикацией и стрелками предоставляет плавное, отзывчивое отображение направления рынка без лишнего шума.
Линия тренда динамически меняет цвет на зеленый в бычьих фазах и на красный в медвежьих фазах, делая направление тренда мгновенно читаемым.
Когда импульс меняется, опциональные стрелки отмечают изменение — зеленые стрелки для восходящих трендов, красные стрелки для нисходящих.
Это позволяет вам рано ловить повороты тренда, избегая ложных сигналов, вызванных рыночным шумом.
Создана для ясности, она плавно адаптируется к цене, сохраняя при этом четкую направленную структуру.
Идеально подходит для точного входа, управления выходами и поддержания соответствия доминирующему тренду.
Используйте ее как самостоятельный инструмент тренда или комбинируйте с вашей существующей стратегией для дополнительного подтверждения.
Чистая визуализация. Четкие сигналы. Уверенная торговля по тренду.
Сводка
Отзывы покупателей
5 | 0 % | |
4 | 100 % | |
3 | 0 % | |
2 | 0 % | |
1 | 0 % |


![Логотип продукта "[Hamster-Coder] Pivot Points MTF"](https://cdn.ctrader.com/image/webp/4c143e5a-309c-40e3-a578-f04d1e133ffa_31159)


