
설명
CHoCH Breakout Block
https://chartshots.spotware.com/c/69960085a796e
이 지표는 가격 행동 및 스마트 머니 개념(SMC) 방법론을 사용하는 트레이더를 위해 설계되었습니다. 권장 사용법:
- 🔍 가능한 구조적 반전의 첫 신호로서 CHoCH 를 식별합니다.
- 👀 생성된 관심 구역 을 관찰합니다: 가격이 일반적으로 새로운 방향으로 계속되기 전에 되돌아오는 영역입니다.
- ⏳ 가격이 구역으로 되돌아오는 것 을 기다리고, 그 안에서 피보나치 수준 (특히 0.382, 0.5, 0.618 및 0.786).
- ✅ 더 높은 정밀도의 진입을 위해 구역 내에서 포용 캔들 (StructureBased 모드일 경우)로 확인합니다.
- ❌ 가격이 구역의 반대 경계를 위반하면 거래가 무효화 됩니다. 이 순간 지표 자체가 구역을 취소합니다.
https://chartshots.spotware.com/c/699600271b05d
📊 1. 3단계 구조 분석
이 지표는 세 개의 중첩된 계층적 수준을 가장 덜 중요한 것부터 가장 중요한 것까지 분석합니다:
- 🔹 단기: 세 개의 연속된 캔들을 비교하여 가장 최근의 지역 고점과 저점을 감지합니다. 가운데 캔들이 이전과 다음 캔들보다 낮으면 지역 저점으로 확인됩니다. 지역 고점은 그 반대입니다.
- 🔸 중기: 단기 포인트 위에 구축됩니다. 단기 스윙이 낮은 저점 또는 높은 고점 패턴을 형성할 때(즉, 세 번 연속 스윙이 방향을 확인할 때) 중기 포인트가 설정됩니다.
- 🔺 장기: 중기 포인트를 기반으로 동일한 방식으로 구축됩니다. 가장 중요한 계층 이며 지표의 주요 이벤트를 트리거합니다.
💡 이 계단식 구조는 실제 구조적 무게가 있는 움직임만 신호를 생성하도록 하여 단기 잡음을 걸러냅니다.
🔄 2. CHoCH — 성격 변화
CHoCH는 지표의 중심 이벤트입니다. 다음과 같은 경우 발생합니다:
- 🟢 강세 CHoCH: 가격이 이전 장기 구조적 고점 위에서 마감하며, 이전 시장 방향은 약세였습니다. 이는 판매자가 통제력을 잃었고 시장이 상승 반전할 수 있음을 나타냅니다.
- 🔴 약세 CHoCH: 가격이 이전 장기 구조적 저점 아래에서 마감하며, 이전 방향은 강세였습니다. 이는 구매자가 통제력을 잃었고 시장이 하락 반전할 수 있음을 나타냅니다.
CHoCH가 감지되면 지표는 다음을 그립니다:
- ➡️ 정확한 돌파 수준에 수평선 (설정된 스타일과 두께로)
- 🏷️ 그 선 위에 "CHoCH" 라벨
- 🟥🟩 반투명한 관심 구역
🗺️ 3. 관심 구역
CHoCH 직후, 지표는 자동으로 주요 가격 구역을 구분합니다:
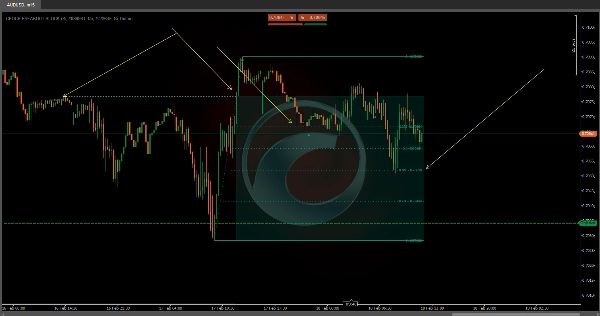
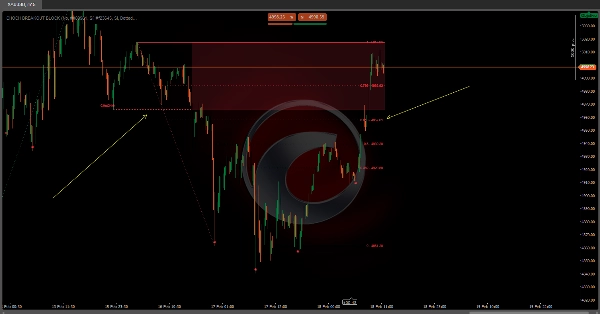
- 🟢 강세 CHoCH의 경우: 구역은 돌파 수준(CHoCH)에서 구조적 스윙과 돌파 순간 사이에 발견된 최저점까지 확장됩니다. 이 구역은 가격이 상승을 계속하기 전에 유동성을 찾기 위해 되돌아올 수 있는 영역을 나타냅니다.
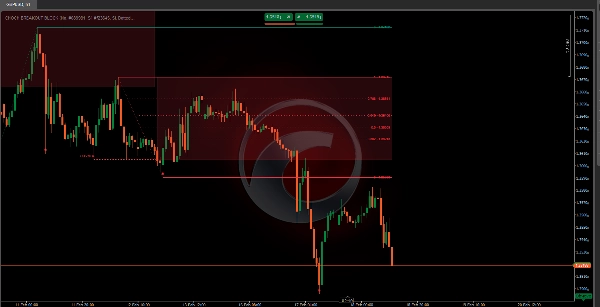
- 🔴 약세 CHoCH의 경우: 구역은 스윙과 돌파 사이에 발견된 최고점에서 CHoCH 수준까지 확장됩니다. 이 구역은 가격이 하락을 계속하기 전에 유동성을 찾기 위해 되돌아올 수 있는 영역을 나타냅니다.
구역은 가격이 경계를 존중하는 한 자동으로 바 단위로 확장됩니다. 가격이 반대 경계를 위반하는 순간 구역 확장이 멈추며, 이는 구역이 테스트되었거나 무효화되었음을 나타냅니다.
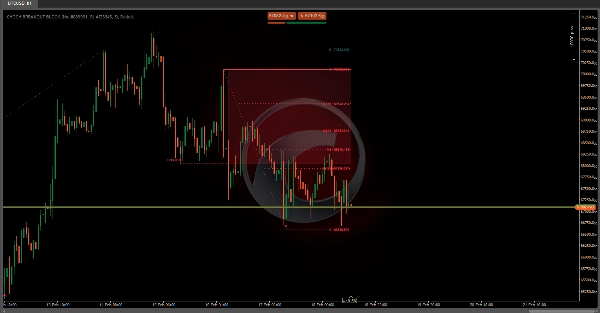
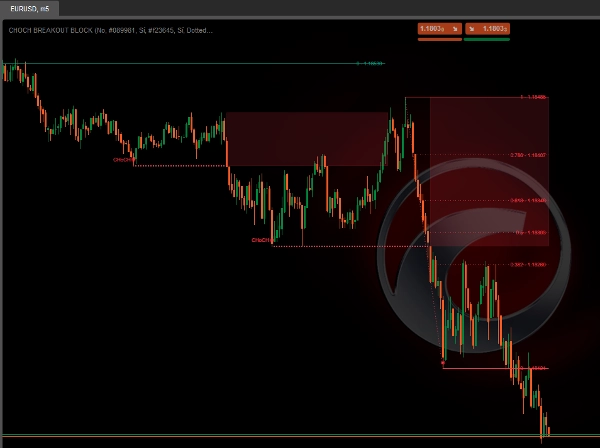
👁️ 차트 이미지에서 볼 수 있듯이, 반투명 빨간 구역은 감지된 CHoCH 이벤트 이후의 약세 관심 지역 을 나타냅니다.
📐 4. 자동 피보나치 수준
CHoCH가 감지된 후, 지표는 즉시 피보나치를 그리지 않습니다. 피보나치는 시장이 새로운 방향에 실제 구조적 무게가 있음을 확인하는 두 번째 단계에서 나타납니다. 이는 두 단계로 이루어집니다:
1단계 — CHoCH 발생: 🏷️ 돌파선, 라벨, 관심 구역이 그려집니다. 피보나치는 아직 보이지 않습니다.
2단계 — 시장이 CHoCH 방향으로 새로운 장기 스윙을 형성: 📐 이 순간에만 지표가 돌파 기준점과 새로 확인된 스윙 사이에 피보나치 수준을 자동으로 투영합니다.
📌 예시: 강세 CHoCH에서는 피보나치가 돌파 중 발견된 최저점에서 이후 시장이 형성하는 첫 번째 장기 고점까지 그려집니다. 가격이 상승 중이지만 아직 그 구조적 스윙을 확정하지 않았다면, 피보나치 수준은 아직 보이지 않습니다 — 이는 의도된 동작이며 버그가 아닙니다.
활성화되면, 수준은 구조가 유효한 동안 바 단위로 확장되며, 새로운 구조적 돌파가 나타나면 자동으로 재계산됩니다. 사용 가능한 수준은 다음과 같습니다:
수준
일반적 의미
0
움직임의 시작점
작은 되돌림
⭐ 첫 번째 중요한 되돌림
0.5
⭐ 중간 수준
⭐ 황금비율
황금비율 변형
⭐ 깊은 되돌림
1
100% 확장
🕯️ 5. 포용 캔들 감지
이 지표는 추가적인 합류 신호로서 포용 캔들 패턴 감지 기능을 포함합니다:
- ▲ 큰 녹색 캔들이 이전의 작은 빨간 캔들을 완전히 흡수할 때 강세 포용가 나타납니다.
- ▼ 큰 빨간 캔들이 이전의 작은 녹색 캔들을 완전히 흡수할 때 약세 포용가 나타납니다.
두 가지 표시 모드가 있습니다:
- 📋 전체: 차트에 나타나는 모든 포용 패턴을 표시합니다.
- 🎯 StructureBased: 활성 관심 구역 내에서 발생하는 포용 패턴만 표시하여 신호의 관련성을 크게 높입니다.
요약
When a CHoCH occurs, the indicator marks the breakout level with a horizontal line and label, and automatically creates a semi-transparent interest zone where price is likely to return before continuing in the new direction. This zone extends dynamically as long as price respects its boundaries and is invalidated if price breaks the opposite boundary.
The indicator also projects Fibonacci retracement levels automatically after the market confirms the new trend direction by forming a new long-term swing. Supported Fibonacci levels include 0.236, 0.382, 0.5, 0.618, 0.65, 0.786, and 1. Additionally, it detects bullish and bearish engulfing candle patterns as confluence signals, with options to display all patterns or only those occurring within active interest zones for higher precision.
This tool supports multiple markets including BTCUSD, EURUSD, GBPUSD, NZDUSD, XAUUSD, NAS100, and USDJPY.
고객 리뷰
5 | 100 % | |
4 | 0 % | |
3 | 0 % | |
2 | 0 % | |
1 | 0 % |


