

설명
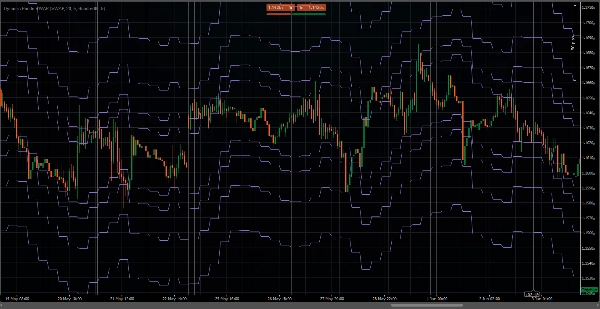
정적인 지지선과 저항선을 신뢰하지 마세요. 이 지표는 널리 사용되는 피보나치와 VWAP를 하나의 설정으로 결합하여 각각의 단점을 해결합니다. 이제 모든 레벨은 머니 플로우, 타임 블록 및 수학적 규칙에 기반한 동적입니다.
이 지표는 이동하는 VWAP/TWAP 평균을 기반으로 계단식 수평선을 그립니다. 부드러운 연속선 대신, 평균을 매 X 바(“계단 단계”)마다 다시 계산하며, 각 단계에서 수직으로 점프하는 평평한 수평 구간을 그립니다. VWAP/TWAP 위아래 선들의 거리는 사용자 선택 비율 스케일(피보나치 스케일)에 곱해진 피보나치 수열을 따릅니다.
매개변수
- 평균 유형 – VWAP(거래량 가중) 또는 TWAP(시간 가중).
- 기간(바) – 평균 계산을 위한 조회 창.
- 위/아래 선 수 – 각 측면에 그릴 피보나치 간격 레벨 수(≥2).
- 피보나치 스케일 – 간격의 기본 백분율 단위.
- X 바마다 업데이트 – 계단 재계산 빈도; 평균과 모든 선은 업데이트 사이에 일정하게 유지됩니다.
사용 방법? 다음과 같이 사용할 수 있습니다:
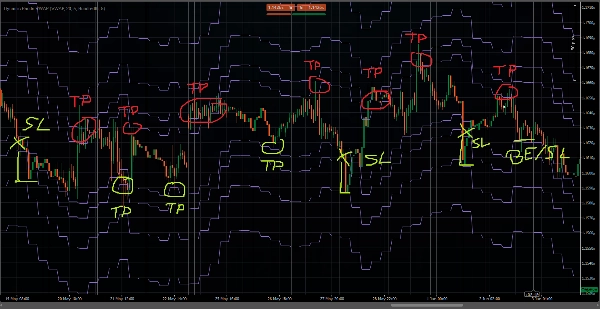
- 모든 평균회귀 전략
- 지지선 및 저항선 검증
- 진입 및 청산에 최적의 가격
- 과매수/과매도 오실레이터
- 다중 시간대 컨플루언스
- 볼린저 밴드 완전 대체
- 기타 등등.
요약
AI summary
Dynamic Bands VWAP is a technical indicator that integrates Fibonacci levels with VWAP (Volume Weighted Average Price) or TWAP (Time Weighted Average Price) to provide dynamic support and resistance levels. Unlike static levels, this indicator recalculates averages and plots horizontal lines in a stepped ladder format every set number of bars, creating flat segments that adjust vertically at each update. The spacing of these lines above and below the average follows a Fibonacci sequence scaled by a user-defined percentage.
Key parameters include the choice between VWAP or TWAP averages, the lookback period for calculations, the number of Fibonacci-spaced lines displayed above and below the average, the Fibonacci scale for spacing, and the frequency of updates (every X bars). The indicator bases its dynamic levels on money flow, time blocks, and mathematical rules.
It can be applied in various trading contexts such as mean-reversion strategies, support and resistance validation, identifying optimal entry and exit prices, overbought/oversold oscillation, multi-timeframe confluence, and as a full alternative to Bollinger Bands. The indicator supports volume and bar data inputs and provides visualizations, signals for breakouts, reversals, volatility regimes, and level touches or breaks.
Key parameters include the choice between VWAP or TWAP averages, the lookback period for calculations, the number of Fibonacci-spaced lines displayed above and below the average, the Fibonacci scale for spacing, and the frequency of updates (every X bars). The indicator bases its dynamic levels on money flow, time blocks, and mathematical rules.
It can be applied in various trading contexts such as mean-reversion strategies, support and resistance validation, identifying optimal entry and exit prices, overbought/oversold oscillation, multi-timeframe confluence, and as a full alternative to Bollinger Bands. The indicator supports volume and bar data inputs and provides visualizations, signals for breakouts, reversals, volatility regimes, and level touches or breaks.
지표 프로필
지표 카테고리
지지 및 저항
출력 유형
시각화
신호
필터
데이터 요구 사항
막대만
거래량
지원되는 신호
돌파
반전
변동성
레벨 터치
레벨 돌파
고객 리뷰
0.0
리뷰: 0
고객 리뷰
이 상품에 대한 리뷰가 아직 없습니다. 이미 사용해 보셨나요? 다른 사람들에게 가장 먼저 소개해 주세요!
상담
자주 묻는 질문(FAQ)
Fibonacci
Key Levels
Volume
VWAP
Support & Resistance
트레이딩 봇, 지표, 플러그인 등 cTrader Store에서 제공되는 상품은 제3자 개발자에 의해 제공되며, 이는 단순히 정보 및 기술적 접근을 목적으로 제공된 것입니다. cTrader Store는 중개인이 아니며, 투자 조언, 개인별 추천 또는 향후 성과에 대한 어떠한 보장도 제공하지 않습니다.






















가격
가입일 24/03/2026
13
판매
112
무료 설치