
Multi-Timeframe Market Levels
지표
11 구매
버전 1.0, Dec 2024
Windows, Mac
5.0
리뷰: 1
설명
향상된 지지 저항 지표
기술적 분석의 힘을 cAlgo용 향상된 지지 저항 지표와 함께 활용하세요. 이 고급 도구는 트레이더가 거래 차트에서 중요한 지지 및 저항 수준을 식별하고 시각화할 수 있도록 설계되어 의사 결정과 거래 전략을 향상시킵니다.
주요 기능:
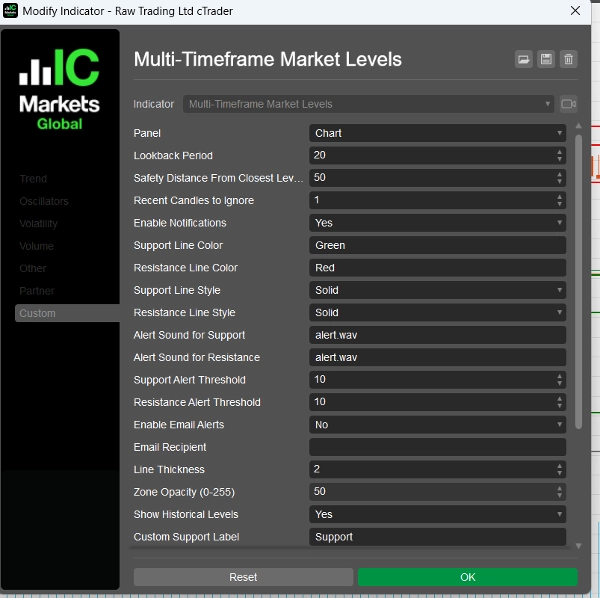
- 사용자 정의 가능한 매개변수: 조회 기간, 안전 거리, 알림 소리 등 조정 가능한 설정으로 지표를 자신의 거래 스타일에 맞게 맞춤 설정하세요.
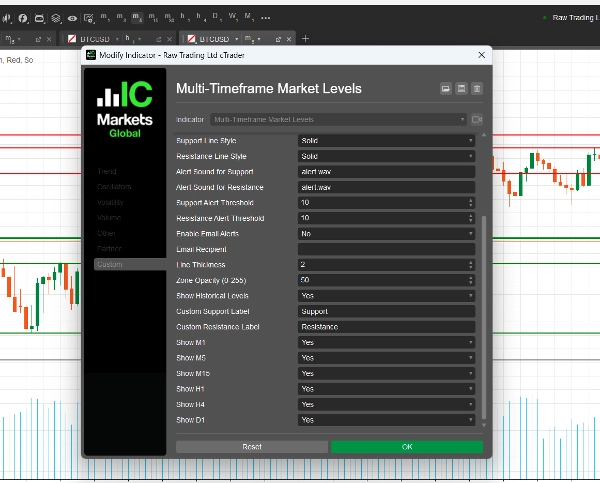
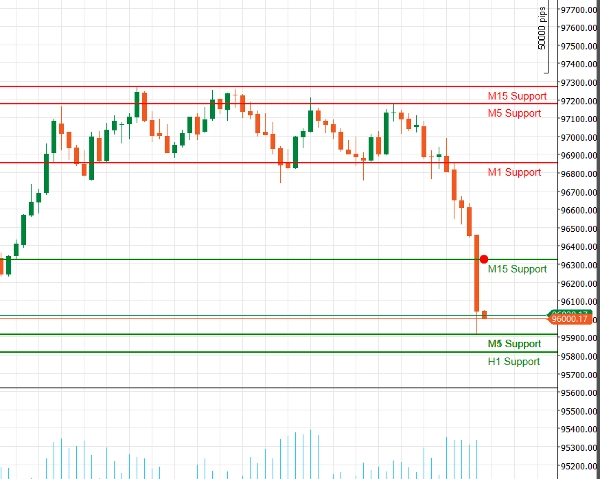
- 다중 시간 프레임 지원: M1, M5, M15, H1, H4, D1 등 여러 시간 프레임을 동시에 분석하여 시장 동향을 포괄적으로 파악하고 다양한 거래 기간에 걸쳐 주요 수준을 식별하세요.
- 실시간 알림: 즉각적인 알림으로 정보를 유지하세요! 가격이 중요한 지지 또는 저항 수준에 접근할 때 오디오 알림과 이메일 알림을 보낼 수 있어 거래 기회를 놓치지 않습니다.
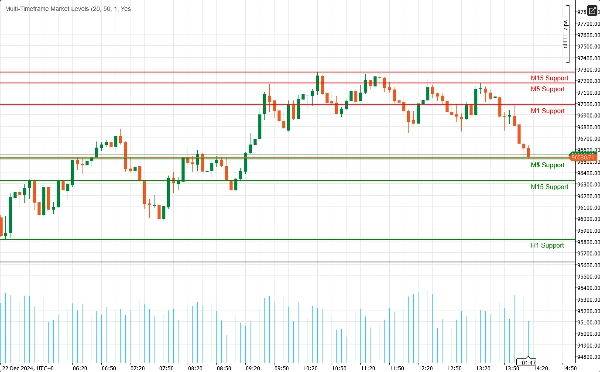
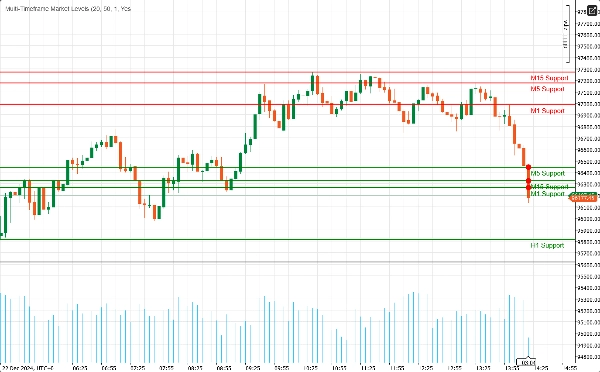
- 시각적 명확성: 사용자 정의 가능한 색상과 선 스타일로 지지 및 저항 수준을 명확하게 시각화하세요. 강조된 영역은 추가적인 맥락을 제공하여 잠재적 반전 지점을 쉽게 식별할 수 있게 합니다.
- 피보나치 통합: 내장된 피보나치 수준 그리기를 통해 지지 및 저항과 함께 잠재적 되돌림 및 확장 수준을 식별하여 분석을 강화하세요.
- 사용자 친화적 인터페이스: 초보자와 경험 많은 트레이더 모두를 위해 설계된 이 지표는 설정이 쉽고 기존 cAlgo 환경에 원활하게 통합됩니다.
향상된 지지 저항 지표 사용 방법
- 설치:
-
- 지표를 다운로드하여 cAlgo 플랫폼에 가져오세요.
- 원하는 차트에 지표를 연결하세요.
- 매개변수 구성:
-
- 거래 스타일에 맞게 설정을 조정하세요. 조회 기간, 안전 거리 설정 및 지지와 저항 수준에 대한 선호하는 색상과 선 스타일을 선택하세요.
- 가격이 이 수준에 접근할 때 알림을 받고 싶다면 알림 기능을 활성화하세요.
- 시간 프레임 선택:
-
- 표시할 시간 프레임을 선택하세요. 거래 전략에 따라 M1, M5, M15, H1, H4, D1의 수준을 표시하거나 숨길 수 있습니다.
- 차트 분석:
-
- 차트에 표시된 지지 및 저항 수준을 관찰하세요. 이 수준들은 가격이 반전하거나 횡보할 가능성이 있는 지점을 나타냅니다.
향상된 지지 저항 지표로 거래하는 방법
- 진입점 식별:
-
- 롱 트레이드: 가격이 지지 수준에 접근할 때, 특히 반등 신호(예: 강세 캔들스틱 패턴)가 보이면 매수 기회를 찾으세요.
- 숏 트레이드: 가격이 저항 수준에 가까워질 때, 특히 약세 신호(예: 약세 캔들스틱 패턴)가 있을 경우 매도하는 것을 고려하세요.
- 알림 사용:
-
- 가격이 주요 지지 또는 저항 수준에 접근할 때 실시간 알림을 활용하여 신속하게 대응하고 잠재적 거래 기회를 활용하세요.
- 다른 지표와 결합:
-
- 이동평균, RSI, MACD 등 다른 기술 지표와 향상된 지지 저항 지표를 결합하여 신호를 확인하고 거래 정확도를 높이세요.
- 손절매 및 이익실현 수준 설정:
-
- 롱 트레이드의 경우 지지 수준 바로 아래에, 숏 트레이드의 경우 저항 수준 바로 위에 손절매 주문을 배치하여 위험을 관리하세요.
- 잠재적 이익을 극대화하기 위해 다음 중요한 지지 또는 저항 수준에 이익실현 목표를 설정하세요.
왜 향상된 지지 저항을 선택해야 할까요?
금융 시장의 복잡성을 탐색하는 것은 어려울 수 있습니다. 향상된 지지 저항 지표는 주요 가격 수준을 식별하고 정보에 기반한 거래 결정을 내리는 데 필요한 도구를 제공합니다. 데이 트레이더이든 장기 투자자이든 이 지표는 거래 도구 모음에 필수적인 추가 요소입니다.
요약
AI 요약
The Multi-Timeframe Market Levels indicator for cAlgo is an enhanced support and resistance tool designed to assist traders in identifying critical price levels across multiple timeframes. It supports simultaneous analysis of M1, M5, M15, H1, H4, and D1 charts, providing a comprehensive view of market dynamics. Key features include customizable parameters such as lookback periods, safety distances, alert sounds, and visual settings like colors and line styles for clear chart representation. The indicator integrates Fibonacci levels to identify potential retracement and extension zones alongside support and resistance. Real-time alerts via audio and email notify users when price approaches key levels, facilitating timely trading decisions. The user-friendly interface is suitable for both novice and experienced traders and integrates seamlessly into the cAlgo platform. Traders can use the indicator to identify entry points for long and short trades, set stop-loss and take-profit levels based on support and resistance, and combine it with other technical indicators like RSI and MACD for enhanced strategy accuracy. Installation involves importing the indicator into cAlgo and attaching it to desired charts, followed by parameter configuration and timeframe selection. This tool aids in visualizing potential reversal or consolidation zones to support informed trading decisions.
지표 프로필
고객 리뷰
5.0
리뷰: 1
5 | 100 % | |
4 | 0 % | |
3 | 0 % | |
2 | 0 % | |
1 | 0 % |
고객 리뷰
August 18, 2025
Displays support/resistance levels from multiple timeframes in one chart. Clear visual hierarchy and flexible settings. Cons: No alerts or tooltips. Can't save presets or filter levels dynamically.
상담
자주 묻는 질문(FAQ)
RSI
MACD
트레이딩 봇, 지표, 플러그인 등 cTrader Store에서 제공되는 상품은 제3자 개발자에 의해 제공되며, 이는 단순히 정보 및 기술적 접근을 목적으로 제공된 것입니다. cTrader Store는 중개인이 아니며, 투자 조언, 개인별 추천 또는 향후 성과에 대한 어떠한 보장도 제공하지 않습니다.


가격
가입일 22/11/2024
140
판매
2.61K
무료 설치