
Descrição
MACD Pro Trader – O Indicador de Negociação MACD Definitivo 🚀
Você está procurando um indicador MACD poderoso e profissional para aprimorar sua estratégia de negociação? MACD Pro Trader é a ferramenta definitiva projetada para traders que desejam precisão, clareza e sinais de alto desempenho em suas decisões de negociação. Seja você um iniciante ou um trader experiente, este avançado indicador MACD ajudará a identificar tendências de mercado, detectar configurações de negociação de alta probabilidade e maximizar seus lucros com confiança!
🔥 Por que escolher o MACD Pro Trader?
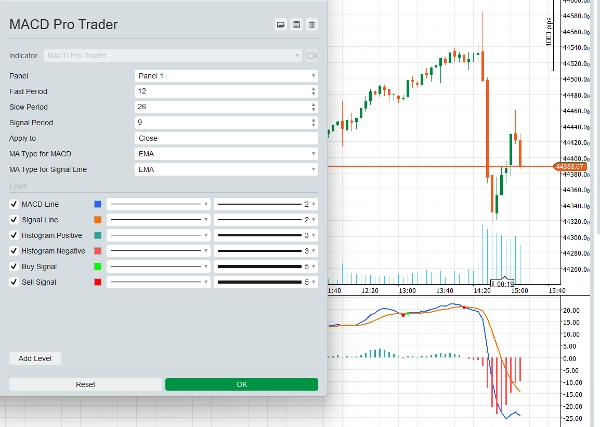
✅ Personalização Avançada da Média Móvel – Escolha entre SMA (Média Móvel Simples) ou EMA (Média Móvel Exponencial) tanto para a linha MACD quanto para a linha de Sinal, dando controle total sobre como o indicador se adapta a diferentes condições de mercado.
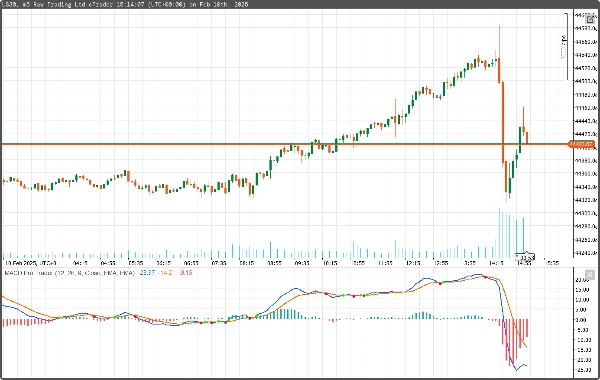
✅ Sinais Inteligentes de Compra e Venda – Obtenha sinais claros de entrada e saída com marcadores verdes e vermelhos visualmente distintos que indicam quando a linha MACD cruza a linha de Sinal. Chega de dúvidas nas entradas de negociação!
✅ Histograma de Dupla Cor para Melhor Visualização de Tendências – Barras positivas e negativas do histograma são codificadas por cores, ajudando você a ver instantaneamente quando o momentum muda a seu favor.
✅ Opções Flexíveis de Preço Aplicado – Aplique os cálculos do MACD aos preços de Abertura, Máxima, Mínima, Fechamento, Mediana, Típico ou Ponderado para ajustar o indicador ao seu estilo de negociação.
✅ Perfeito para Day Trading e Swing Trading – Projetado para funcionar em Forex, Ações, Índices e Cripto, seja você fazendo scalping no gráfico de 1 minuto ou negociando no timeframe de 4 horas.
✅ Integração Perfeita com o cTrader – Totalmente otimizado para cTrader com desempenho em tempo real e atraso mínimo, dando a você uma vantagem sobre os indicadores MACD tradicionais.
📈 Como usar o MACD Pro Trader para Day Trading
Estratégia: O Cruzamento MACD + Confirmação de Momentum
Esta estratégia simples, porém poderosa, é projetada para capturar movimentos de preço de curto prazo e maximizar lucros em mercados com tendência.
🔹 Passo 1: Identifique a Tendência
- Use o Cruzamento da Linha MACD e da Linha de Sinal como seu primeiro gatilho.
- Procure o MACD cruzando acima da linha de Sinal para uma configuração altista.
- Procure o MACD cruzando abaixo da linha de Sinal para uma configuração baixista.
🔹 Passo 2: Confirme com o Histograma
- Um histograma positivo crescente confirma um forte momentum altista.
- Um histograma negativo crescente confirma um forte momentum baixista.
- Se o histograma estiver fraco ou plano, espere por um sinal mais forte.
🔹 Passo 3: Entre na Negociação
- Entrada de Compra: Quando o MACD cruza acima da linha de Sinal e o histograma fica verde.
- Entrada de Venda: Quando o MACD cruza abaixo da linha de Sinal e o histograma fica vermelho.
🔹 Passo 4: Defina Stop Loss e Take Profit
- Stop Loss: Coloque seu stop loss logo abaixo da mínima recente do swing (para compra) ou acima da máxima recente do swing (para venda).
- Take Profit: Mire em 2x o seu stop loss para uma boa relação risco-retorno (por exemplo, arrisque 10 pips para ganhar 20 pips).
🔹 Dica Bônus: Use Timeframes Maiores para Confirmação
Antes de entrar em uma negociação, verifique o timeframe maior (por exemplo, 15m se estiver negociando 5m) para confirmar a direção da tendência. Se ambos os timeframes estiverem alinhados, sua negociação tem maior probabilidade de sucesso!
🎯 Para quem é o MACD Pro Trader?
✅ Traders de Forex que buscam sinais MACD de alta precisão.
✅ Scalpers e day traders que precisam de pontos de entrada rápidos e confiáveis.
✅ Traders de Ações e Cripto que querem aproveitar tendências com confiança.
✅ Swing traders que desejam identificar mudanças de momentum de longo prazo.
Se você está cansado de perder ótimas negociações ou de ter dificuldade para cronometrar suas entradas, MACD Pro Trader é a solução que você esperava!
💎 Adquira o MACD Pro Trader hoje e leve sua negociação para o próximo nível!
🔹 100% Otimizado para cTrader – Sem atrasos, sem repintura, apenas sinais limpos e acionáveis.
🔹 Download Instantâneo – Comece a usar em minutos!
🔹 Atualizações Vitalícias – Receba todas as melhorias futuras sem custo adicional.
📥 Garanta sua cópia agora e comece a negociar com mais inteligência! 🚀
Resumo
A dual-tone histogram visually represents momentum shifts with color-coded positive and negative bars, enhancing trend analysis. Users can apply MACD calculations to various price types including Open, High, Low, Close, Median, Typical, or Weighted prices to tailor the indicator to their trading style.
MACD Pro Trader is suitable for scalpers, day traders, swing traders, and those seeking to identify both short-term and long-term momentum changes. It is optimized for real-time performance with minimal lag on cTrader. The product includes a recommended trading strategy based on MACD line and Signal line crossovers confirmed by histogram momentum, with guidance on entry, stop loss, and take profit placement. Higher timeframe confirmation is suggested to improve trade probability. The indicator supports multiple timeframes from 1-minute scalping to 4-hour swing trading.
Avaliações de clientes
5 | 50 % | |
4 | 50 % | |
3 | 0 % | |
2 | 0 % | |
1 | 0 % |


