
Advanced RSI Indicator
지표
494 다운로드
버전 1.0, Apr 2025
Windows, Mac
5.0
리뷰: 1

설명
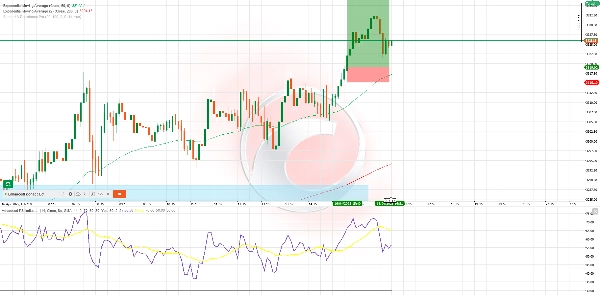
🧠 고급 RSI 지표 – 정밀 모멘텀 분석
더 스마트한 RSI로 시장 동향에 대한 깊은 통찰력 얻기
이 고급 RSI 지표는 정밀함과 스마트 신호 필터링을 중시하는 트레이더를 위해 개발된 클래식 RSI 도구의 강력한 진화입니다. 고급 알고리즘 스무딩, 적응형 구역, 통합된 다이버전스 감지를 통해 모든 시장과 시간대에 대해 정교한 모멘텀 분석을 제공합니다.
🔍 주요 기능:
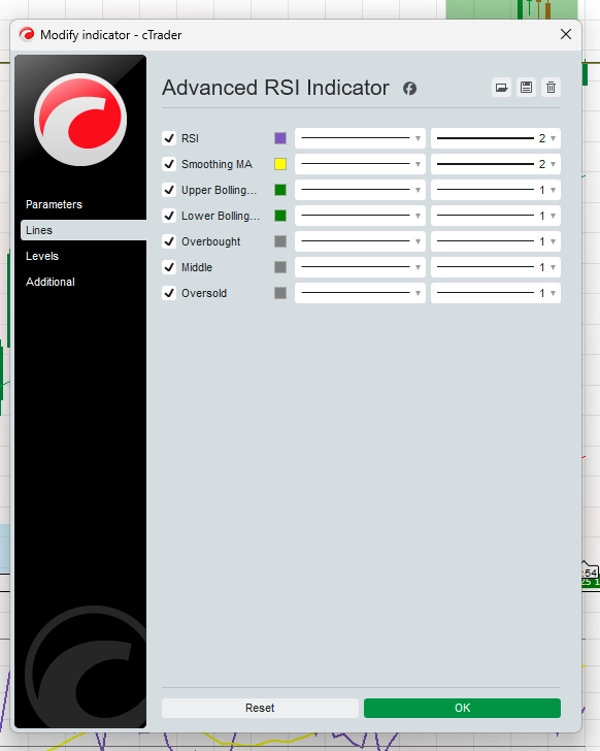
✅ 스무딩된 RSI 곡선
시장 동향에 대한 더 명확한 통찰을 위해 불규칙한 움직임과 잘못된 신호를 줄입니다.
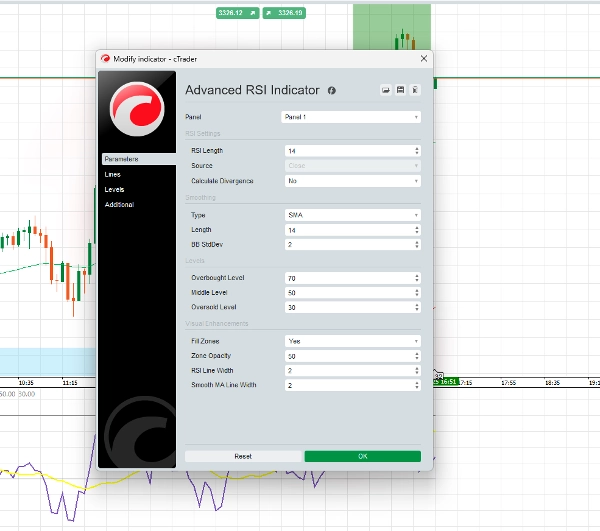
✅ 적응형 신호 구역
시장 변동성에 반응하는 동적 임계값으로 전통적인 70/30 수준을 넘어섭니다.
✅ 색상 코드화된 모멘텀 구역
직관적인 시각 디자인으로 강세 또는 약세 모멘텀을 빠르게 평가합니다.
✅ 다이버전스 알림
전략적 의사결정을 지원하기 위해 강세 및 약세 다이버전스 설정을 강조합니다.
✅ 맞춤 알림 시스템
RSI 레벨 교차 및 다이버전스 신호에 대한 알림을 설정하여 중요한 순간을 놓치지 않습니다.
✅ 다중 자산, 다중 시간대
외환, 암호화폐, 주식, 지수 등 다양한 시장과 M1부터 일간 차트까지 최적화되어 있습니다.
⚙️ 전략 예시 – RSI 웨이브 라이드
적합 대상: H1 및 H4 스윙 트레이드
사용 지표: 고급 RSI, 50 EMA, 200 EMA
매수 예시:
- 가격이 50 및 200 EMA 위에 있음
- RSI가 40 아래로 떨어졌다가 상승하기 시작함
- 강세 모멘텀 색상 나타남
- (선택 사항) 강세 다이버전스 감지됨
- 진입: 신호 위에서 캔들 마감
- 손절: 마지막 스윙 저점 아래
- 목표: 위험 대비 1.5배~2배 또는 최근 저항선
매도 예시:
- 가격이 50 및 200 EMA 아래에 있음
- RSI가 60 위로 올라갔다가 하락하기 시작함
- 약세 모멘텀 색상이 방향을 확인함
- (선택 사항) 약세 다이버전스가 강도를 더함
- 진입: 확인 캔들 마감
- 손절: 마지막 스윙 고점 위
- 목표: 위험 대비 1.5배~2배 또는 최근 지지선
💬 트레이더들이 이 도구를 선택하는 이유:
- 사용자 친화적이면서도 강력함
- 재도색 없는 신호
- 주요 시장에서 검증됨
- 단독 또는 다른 전략과 함께 사용 가능
요약
AI 요약
The Advanced RSI Indicator is an enhanced version of the classic Relative Strength Index tool designed for precise momentum analysis across all markets and timeframes. It features advanced algorithmic smoothing to reduce noise and false signals, adaptive signal zones that adjust dynamically to market volatility, and color-coded momentum zones for quick visual assessment of bullish or bearish trends. Integrated divergence alerts highlight potential bullish or bearish setups, supporting strategic decision-making. The indicator includes a customizable alert system for RSI level crossings and divergence signals, ensuring timely notifications. It is optimized for multi-asset use, including forex, cryptocurrencies, stocks, and indices, and supports timeframes from one minute to daily charts. A sample strategy, "RSI Wave Ride," demonstrates its application in H1 and H4 swing trades using the Advanced RSI alongside 50 and 200 EMAs. The tool provides non-repainting signals and can be used standalone or combined with other strategies. Key features include smoothed RSI curves, adaptive zones, divergence detection, and multi-timeframe compatibility.
지표 프로필
고객 리뷰
5.0
리뷰: 1
5 | 100 % | |
4 | 0 % | |
3 | 0 % | |
2 | 0 % | |
1 | 0 % |
고객 리뷰
August 18, 2025
Pros: Enhanced RSI with adaptive levels, clear visuals, and flexible settings. Works well on all timeframes for trend confirmation and reversal detection. Cons: No alerts or template saving. Can generate noise on lower timeframes without filters.
상담
자주 묻는 질문(FAQ)
Forex
Signal
Indices
RSI
Crypto
Stocks
트레이딩 봇, 지표, 플러그인 등 cTrader Store에서 제공되는 상품은 제3자 개발자에 의해 제공되며, 이는 단순히 정보 및 기술적 접근을 목적으로 제공된 것입니다. cTrader Store는 중개인이 아니며, 투자 조언, 개인별 추천 또는 향후 성과에 대한 어떠한 보장도 제공하지 않습니다.


좋아하실 만한 다른 항목


가격
가입일 22/11/2024
134
판매
2.59K
무료 설치