

Beschreibung
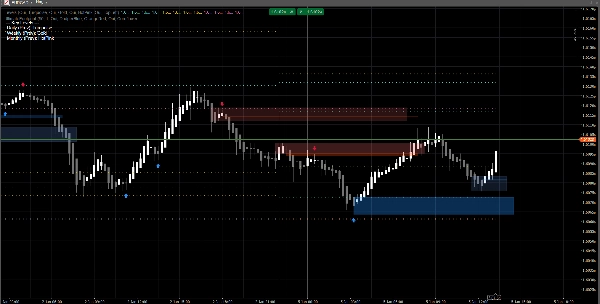
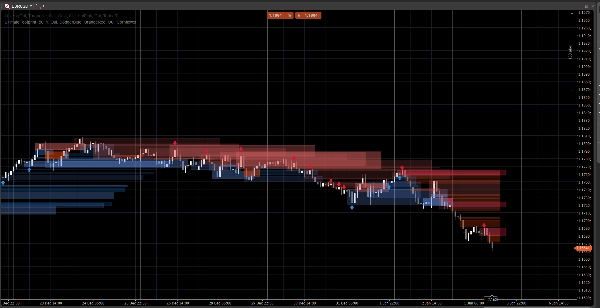
Ein sauberes Markstruktur-System, das Preislücken, Orderblöcke und ausbruchbasierte Signale anzeigt, mit optionaler Volumenbestätigung und Retest-Warnungen. Entwickelt für Klarheit sowohl auf Standard-Charts als auch Renko.
Dieser Indikator konzentriert sich auf Lesbarkeit und Ausführung, nicht auf Überfrachtung. Zonen werden nach vorne verlängert und automatisch verwaltet (Ablauf / Ungültigmachung), was Ihnen hilft, die wichtigen Levels zu verfolgen, während sich der Preis entwickelt.
Was er erkennt
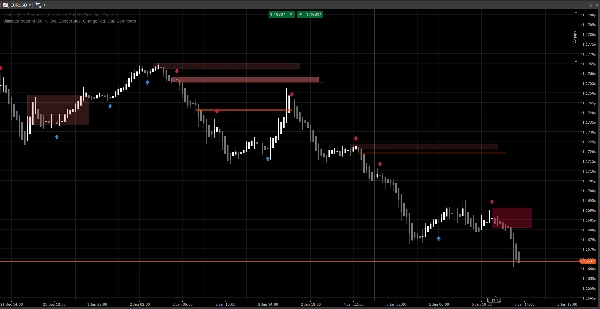
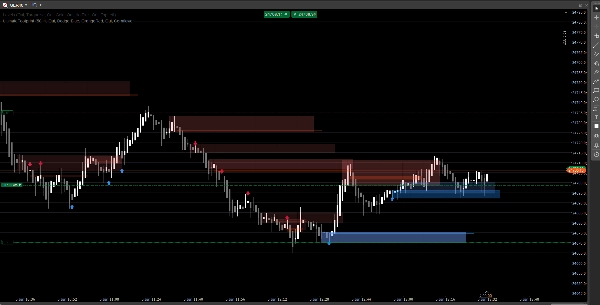
Preislücken (3-Bar Ineffizienzen)
- Hebt bullische und bärische Lücken direkt im Chart hervor
- Optionale Anzeige (umschaltbar Ein/Aus)
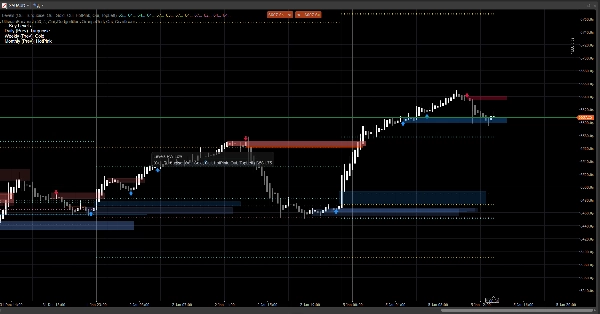
Orderblöcke (letzte entgegengesetzte Kerze vor der Verschiebung)
- Bullische und bärische OB-Zonen
- Automatisch nach vorne verlängert bis zur Ungültigmachung / maximaler Verlängerung
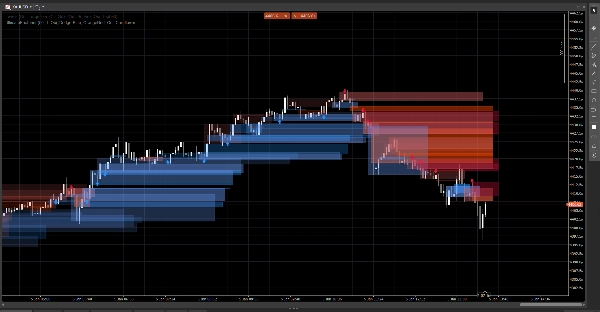
Strukturausbruch-Signale (Swing-Ausbruch-Logik)
- Ausbruchbasierte Erkennung mit Swing-Hochs/-Tiefs
- Druckt Signalpfeile (hoch/runter), wenn ein neuer Orderblock bestätigt wird
Echtzeit-Updates
- Entwickelt, um unter Live-Bedingungen flüssig zu aktualisieren
- Funktioniert auf klassischen Kerzen und verhält sich gut bei Renko-Preisbewegungen
Intelligente Filterung (optional)
Volumenbestätigung
- Sie können eine Volumen-Z-Score Bestätigung verlangen, bevor ein Orderblock-Signal validiert wird
- Anpassbare Basislinie und Sensitivität
Warnungen (optional)
Aktivieren Sie Warnungen für:
- Neuen Orderblock erkannt
- Orderblock-Retest mit Richtung (Ablehnungskerze)
Wie man es benutzt (einfacher Arbeitsablauf)
- Verwenden Sie Preislücken und Orderblöcke als Reaktionszonen (Interessensgebiete).
- Lassen Sie Signale Strukturbrüche und die entsprechende OB-Formation hervorheben.
- Verwenden Sie Retest-Warnungen, um Rückkehr in die Zone mit Ablehnungsverhalten zu erfassen.
- Kombinieren Sie mit Ihren eigenen Ein- und Ausstiegen (Risikomanagement bleibt bei Ihnen).
Übersicht der Eingaben
Volumenlogik
- Volumen-Basislinie: Glättungsperiode für Z-Score-Berechnungen
- Volumen-Sensitivität: steuert, wie stark das Volumen die Sichtbarkeit der Zone beeinflusst
Preislücken
- Preislücken anzeigen
- Farben für bullische / bärische Lücken
Orderblöcke
- OB anzeigen
- Farben für bullische / bärische OB
- Maximale Verlängerung: wie weit Zonen nach vorne verlängert werden
Signale
- Pfeile anzeigen
- Swing-Rückblick: definiert das Erkennungsfenster für Swings
- Volumenbestätigung erforderlich (optional)
- Volumenschwelle + Volumenperiode
- Signal-Farben
- Zonentransparenz
- Maximale Verlängerungs-Bars (Signale)
Warnungen
- Warnungen aktivieren
- Warnung neuer OB
- Warnung Retest
FAQ
1) Repaintet der Indikator?
Nein.
Der Indikator verschiebt historische Signale nicht an neue Positionen, nachdem die Kerze geschlossen ist.
- Zonen (Lücken / OB-Rechtecke) werden aus historischen Bars erstellt und dann nach vorne verlängert.
- Signale (Pfeile) werden aus abgeschlossenen Kerzenbedingungen bestätigt (Swing-Ausbruch + OB-Auswahl).
Sobald ein Pfeil gedruckt wurde, wird er nicht nachträglich verschoben.
Wichtiger Hinweis (normales Verhalten):
Während die aktuelle Kerze noch gebildet wird, können sich Preise (Hoch/Tief/Schluss) noch ändern. Dies kann verursachen:
- dass eine Zone ihre rechte Kantenverlängerung aktualisiert (visuelle Verlängerung),
- dass eine Retest-Bedingung vorübergehend wahr und dann falsch auf derselben bildenden Kerze ist.
Das ist kein Repainting — es ist eine Echtzeit-Aktualisierung auf einer unvollständigen Kerze.
2) Was ist hier der Unterschied zwischen „Redraw“ und „Repaint“?
Redraw = ja (beabsichtigt).
Repaint = nein.
- Redraw bedeutet, dass Rechtecke im Chart neu gezeichnet/verlängert werden, sodass die Zone in die Zukunft projiziert bleibt. Dies ist für eine Live-„Footprint“-Art Overlay erforderlich.
- Repaint würde bedeuten, dass der Indikator vergangene bestätigte Signale (Pfeile/Zonen) nachträglich ändert. Das passiert nicht.
3) Warum ändern sich Zonen manchmal in Form oder Transparenz?
Weil Zonen volumen-gewichtet sind und ein Z-Score Modell verwenden:
SMA(volume)+StdDev(volume)über Ihre Basisperiode- Die Opazität/Alpha skaliert mit der Volumenabweichung
Wenn Sie also ändern:
- Volumen-Basislinie
- Volumen-Sensitivität
- oder der Symbol-Feed sich unterscheidet
Kann die visuelle Intensität variieren. Die Position der Zone bleibt preisbasiert; die Sichtbarkeit kann den Volumenkontext widerspiegeln.
4) Warum fehlen manchmal Warnungen oder sind „aus“?
Es gibt 3 technische Gründe, und alle sind beabsichtigt:
A) Warnungen erfordern eine strenge Übereinstimmungsbedingung
Für eine Retest-Warnung verlangt der Indikator:
- Preis überlappt die OB-Zone, UND
- eine Ablehnungskerzen-Bedingung erfüllt ist (Beispiel: bullische Ablehnung erfordert
Close > Open)
Wenn der Preis die Zone berührt, aber neutral / entgegengesetzt schließt, wird keine Retest-Warnung ausgelöst.
B) Einmalige Warnlogik (Anti-Spam)
Jeder OB hat eine interne Markierung (z.B. Alerted), damit Sie nicht bei jedem Tick wiederholt Warnungen erhalten.
Wenn die erste Berührung die Ablehnungsregel nicht erfüllte und später doch, aber die Markierung bereits gesetzt wurde (je nach Version), kann es so erscheinen, als sei die Warnung „aus“.
C) Chart-Typ-Verhalten (Renko / Tick-Aggregation)
Bei Renko ist der „aktuelle Stein“ keine klassische Kerze. Während der Bildung:
- können Open/Close instabil oder gleich sein
- kann die Retest-Logik intrabar auftreten, aber nicht bei Schluss bestätigt werden
Im Live-Handel gilt für maximale Zuverlässigkeit:
- Neue OB-Warnungen sind in der Regel sauber
- Retest-Warnungen sollten als „bestätigte Ablehnungs“-Warnungen behandelt werden (nicht nur ein Docht-Touch)
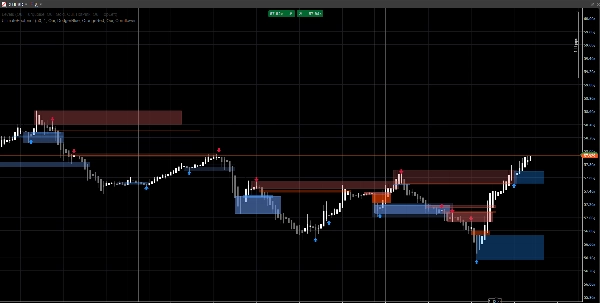
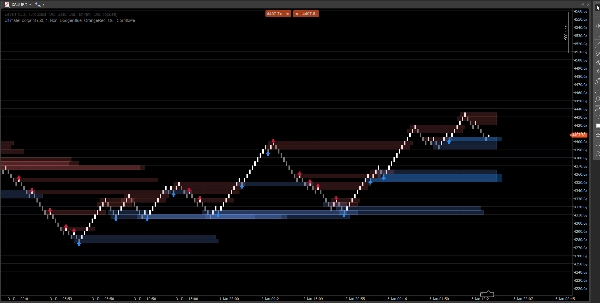
5) Warum zeigen einige OBs im Screenshot keinen Pfeil (oder warum passt der Pfeil nicht zu jedem OB)?
Weil Zonen und Pfeile nicht vom gleichen Mechanismus stammen:
- Zonen (OB-Rechtecke) können aus der Zonenerkennungslogik stammen (gap-abgeleitete OB / Preisaktionszonen).
- Pfeile werden nur gedruckt, wenn ein Strukturereignis erkannt wird:
-
- ein Swing-Hoch/-Tief wird gebrochen (Break of Structure),
- dann sucht der Algorithmus rückwärts nach der letzten entgegengesetzten Kerze = der gültige OB.
Sie können also eine OB-Zone ohne Pfeil sehen, wenn:
- kein validierter Swing-Ausbruch vorlag,
- der OB-Kandidat den Volumenfilter nicht erfüllte (wenn aktiviert),
- oder es eine Zone ist, die vom Gap-Mechanismus erstellt, aber nicht vom Struktur-Mechanismus bestätigt wurde.
Genau deshalb ist das Tool nützlich:
Zonen geben Ihnen die Landkarte. Pfeile heben die Momente mit der höchsten Übereinstimmung hervor.
6) Kann ich erzwingen, dass OBs immer mit Pfeilen übereinstimmen?
Ja, technisch können Sie es im „Nur-Signale“-Modus betreiben, indem Sie die Zonenschicht deaktivieren, die Sie nicht wollen:
- Schalten Sie Preislücken aus, wenn Sie nur strukturgetriebene Zonen wollen
- Schalten Sie OB anzeigen (Zonen) aus, wenn Sie nur pfeilbestätigte OBs wollen
7) Funktioniert es auf allen Zeitrahmen und Symbolen?
Ja, aber die Ergebnisse hängen ab von:
- Volatilität,
- Liquidität,
- Tick-Volumenqualität,
- und der Marktsession.
Krypto und Indizes verhalten sich anders als FX.
Hinweise & Haftungsausschluss
Dieser Indikator ist ein visuelles Entscheidungsunterstützungs-Tool, kein Signaldienst und keine Finanzberatung.
Alle Märkte und Zeitrahmen verhalten sich unterschiedlich — validieren Sie immer mit Ihren Daten und managen Sie das Risiko angemessen. Vergangenes Verhalten garantiert keine zukünftigen Ergebnisse.
Zusammenfassung
Kundenbewertungen
5 | 100 % | |
4 | 0 % | |
3 | 0 % | |
2 | 0 % | |
1 | 0 % |


