

Beschreibung
Fortschrittlicher MACD-Indikator mit dynamischem Farbwechsel und Volumen
Beschreibung: Unser fortschrittlicher MACD-Indikator ist nicht nur ein einfaches Histogramm. Dieser Indikator wurde entwickelt, um einen klaren und dynamischen Überblick über Markttrends zu bieten, mit einzigartigen Funktionen, die ihn für jeden ernsthaften Trader unverzichtbar machen.
Hauptmerkmale:
- Dynamischer Farbwechsel:
-
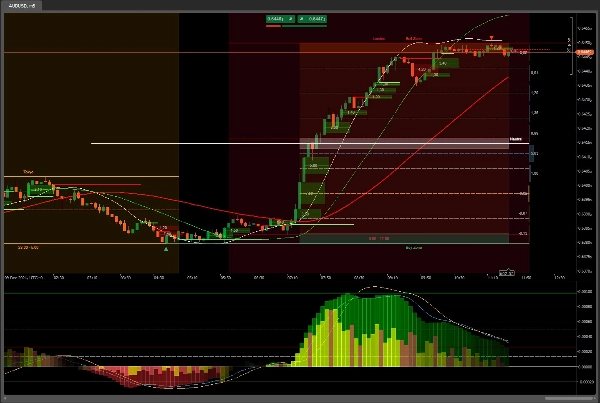
- Positiv: Das Histogramm wechselt von Grün zu Weiß, wenn die Werte steigen, und bietet eine klare Visualisierung von Aufwärtstrends.
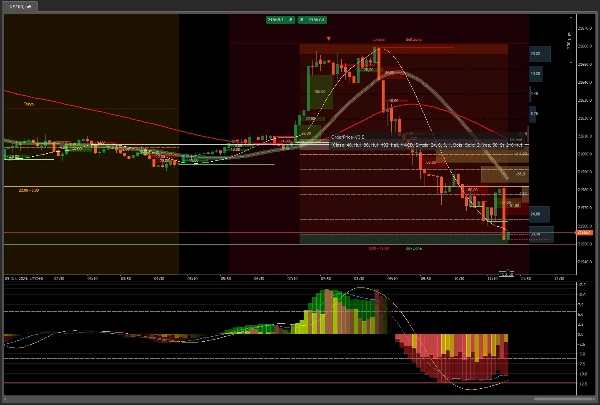
- Negativ: Das Histogramm wechselt von Rot zu Weiß, wenn die Werte fallen, und hebt Abwärtstrends hervor.
- Volumenindikator:
-
- Positives Volumen: Dargestellt durch grüne Balken, die eine Zunahme des Handelsvolumens anzeigen.
- Negatives Volumen: Dargestellt durch rote Balken, die eine Abnahme des Handelsvolumens anzeigen.
- Klare Visualisierung: Die Kombination der Farben in den Volumenbalken (Grün, Gelb, Braun, Rot) bietet einen klaren Überblick über Kauf- und Verkaufsaktivitäten am Markt.
- Automatischer Zoom:
-
- Hält den Indikator zentriert und automatisch für eine optimale Ansicht angepasst, ohne dass ständige manuelle Anpassungen erforderlich sind.
- Anpassbarer gleitender Durchschnitt:
-
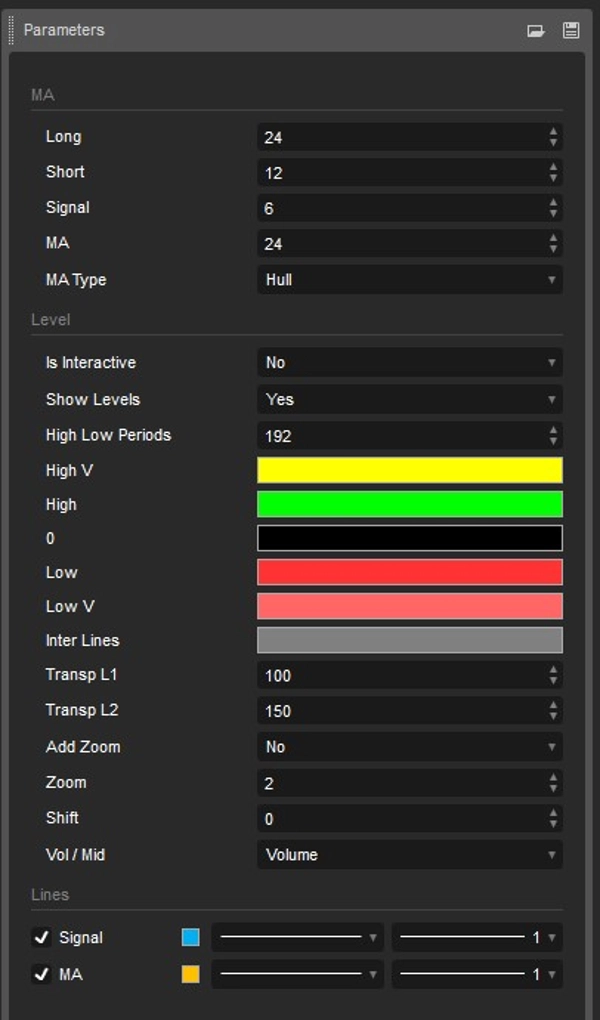
- Beinhaltet einen zusätzlichen gleitenden Durchschnitt, den Sie aus den verfügbaren Optionen auswählen können, was eine größere Anpassung und Anpassung an Ihre Handelsstrategie ermöglicht.
- Hochs und Tiefs:
-
- Zeigt die höchsten und niedrigsten Niveaus im ausgewählten Zeitraum an und bietet einen klaren Überblick über Marktextrme.
Vorteile:
- Visuelle Klarheit: Dynamische Farbwechsel erleichtern die Identifizierung von Trends und Wendepunkten im Markt.
- Anpassungsmöglichkeiten: Die Möglichkeit, verschiedene gleitende Durchschnitte auszuwählen und Farbstufen anzupassen, ermöglicht es Ihnen, den Indikator auf Ihre spezifischen Bedürfnisse zuzuschneiden.
- Effizienz: Der automatische Zoom sorgt dafür, dass Sie immer die beste Ansicht des Indikators haben, ohne manuelle Anpassungen vornehmen zu müssen.
- Umfassende Analyse: Die Einbeziehung von Volumen sowie Hoch- und Tiefstständen bietet einen vollständigeren Überblick über den Markt.
Ideal für:
- Trader, die ein fortschrittliches und anpassbares Werkzeug zur Verbesserung ihrer technischen Analyse suchen.
- Diejenigen, die eine klare und dynamische Visualisierung von Markttrends wünschen.
- Nutzer, die Effizienz und Anpassbarkeit in ihren Handelswerkzeugen schätzen.
Mit zusätzlichen Tools wie
OrderPrice V3 https://ctrader.com/products/397
NTMPICLL https://ctrader.com/products/327
Range Box Level https://ctrader.com/products/245
Oder RangeBoxFibonacci https://ctrader.com/products/526
Market Session https://ctrader.com/products/525
MacdVolume https://ctrader.com/products/267
4MA https://ctrader.com/products/247
Wirst du unbesiegbar sein
Viel Glück 😀
Zusammenfassung
Key functionalities include auto zoom, which keeps the indicator centered and optimally scaled without manual adjustment, and a customizable moving average that can be selected from available options to fit different trading strategies. The indicator also displays the highest and lowest price levels within the selected period, providing insight into market extremes.
Designed for traders seeking a customizable and efficient tool, MACDVolume offers clear visual cues for trend identification and comprehensive market analysis by integrating volume and price extremes. It supports markets such as Forex and Stocks and is suitable for users who prioritize clarity, customization, and efficiency in their technical indicators.
Kundenbewertungen
5 | 100 % | |
4 | 0 % | |
3 | 0 % | |
2 | 0 % | |
1 | 0 % |


