
RangeBoxFibonacci
อินดิเคเตอร์
11 การซื้อ
เวอร์ชัน 1.0, Feb 2025
Windows, Mac
4.5
รีวิว: 2
คำอธิบาย
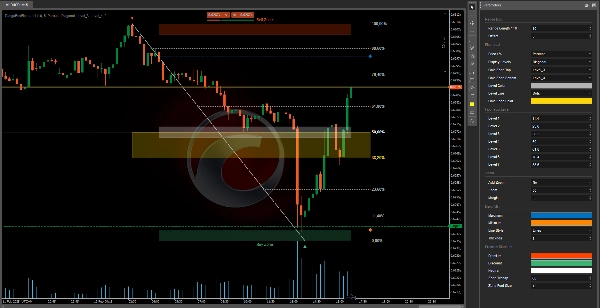
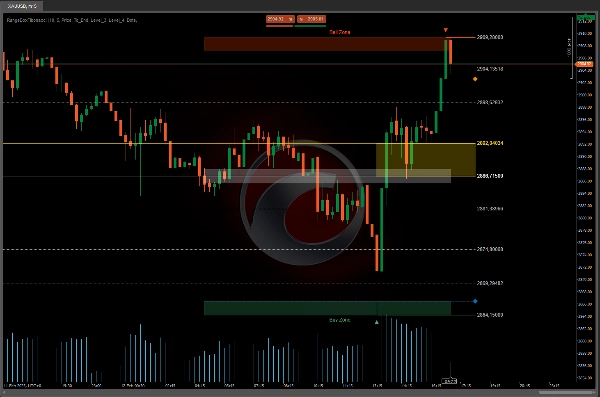
ตัวบ่งชี้ Fibonacci retracement นี้ช่วยให้เทรดเดอร์สามารถมองเห็นและปรับแต่งระดับการย้อนกลับที่สำคัญเพื่อระบุโซนซื้อและขายที่เป็นไปได้ในตลาด
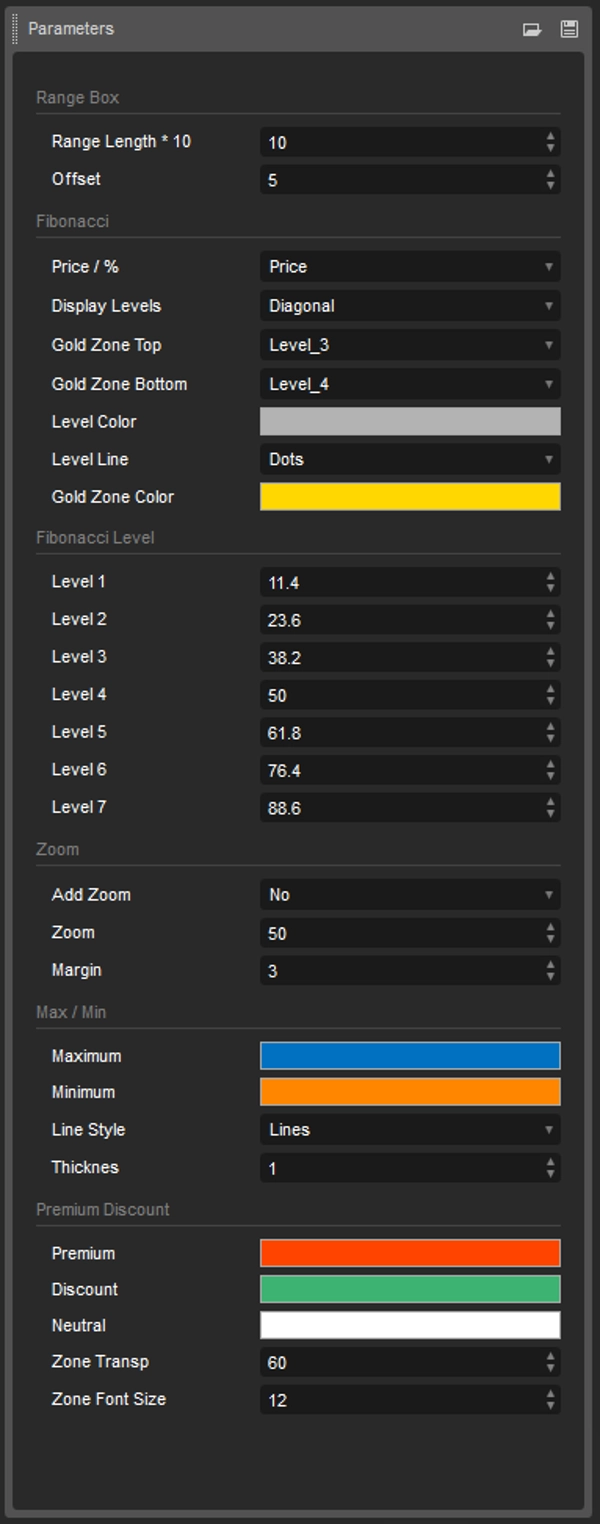
นอกจาก "โซนขาย" และ "โซนซื้อ" ที่มีสีสันแล้ว ผู้ใช้ยังสามารถปรับระดับ Fibonacci ตามที่ต้องการได้
ตัวบ่งชี้นี้มาพร้อมกับตัวบ่งชี้แจ้งเตือนแยกต่างหากเพื่อประสบการณ์การเทรดที่สมบูรณ์ยิ่งขึ้น
ด้วยตัวบ่งชี้ Fibonacci retracement นี้ เทรดเดอร์มีการควบคุมเต็มที่เหนือระดับการย้อนกลับที่แสดงบนแผนภูมิ
ความสามารถในการปรับแต่งระดับ Fibonacci พร้อมกับโซนที่มีสีสันและตัวบ่งชี้แจ้งเตือนแยกต่างหาก ช่วยให้ผู้ใช้สามารถปรับเครื่องมือนี้ให้เหมาะกับกลยุทธ์การเทรดแต่ละบุคคล
หากคุณรวมเครื่องมือต่างๆ เช่น:
- OrderPrice V3 https://ctrader.com/products/397
- NTMPICLL https://ctrader.com/products/327
- MACDVolume https://ctrader.com/products/267
- MarketSession-MX https://ctrader.com/products/525
จะไม่มีทางเสียเงินจำนวนมาก
สรุป
สรุปโดย AI
RangeBoxFibonacci is a customizable Fibonacci retracement indicator designed for traders to identify potential buy and sell zones across various markets including Forex, commodities, and indices such as EURUSD, GBPUSD, NZDUSD, XAUUSD (gold), and NAS100. The indicator displays key Fibonacci retracement levels on the chart, which users can adjust to fit their trading strategies. It highlights colored zones labeled "Sell Zone" and "Buy Zone" to visually assist in market analysis. Additionally, it is complemented by a separate alerts indicator to notify users of relevant market conditions. The tool supports integration with other trading aids like OrderPrice V3, NTMPICLL, MACDVolume, and MarketSession-MX, enhancing its functionality. This indicator provides traders with full control over displayed retracement levels, enabling tailored technical analysis for improved decision-making.
โปรไฟล์อินดิเคเตอร์
รีวิวจากลูกค้า
4.5
รีวิว: 2
5 | 50 % | |
4 | 50 % | |
3 | 0 % | |
2 | 0 % | |
1 | 0 % |
รีวิวจากลูกค้า
August 18, 2025
Displays Fibonacci zones in structured 9-level ranges. Lightweight and visually intuitive. Works on all timeframes. Cons: No alerts, tooltips, or preset saving. Needs confirmation tools to reduce subjectivity.
February 25, 2025
tested small first and that felt like the right move, and Bad settings can ruin the idea.
การสนทนา
คำถามที่พบบ่อย
Forex
EURUSD
Commodities
GBPUSD
NZDUSD
XAUUSD
NAS100
ผลิตภัณฑ์ที่มีให้บริการผ่าน cTrader Store รวมถึงบอทการเทรด อินดิเคเตอร์ และปลั๊กอิน มีให้บริการโดยนักพัฒนาบุคคลที่สามและมีไว้เพื่อวัตถุประสงค์ในการเข้าถึงข้อมูลและทางเทคนิคเท่านั้น cTrader Store ไม่ใช่โบรกเกอร์และไม่ได้ให้คำแนะนำการลงทุน คำแนะนำส่วนบุคคล หรือการรับประกันผลการดำเนินงานในอนาคต


ราคา
147
การขาย
11.17K
ติดตั้งฟรี