
Area of Interest
Indicatore
2 acquisti
Versione 1.0, Aug 2025
Windows, Mac
4.0
Recensioni: 2
Da 29/05/2025
3.04M
Volume negoziato
45.22K
Profitto in pip
29
Vendite
768
Installazioni gratuite
Descrizione
1. Scopo dell'Indicatore
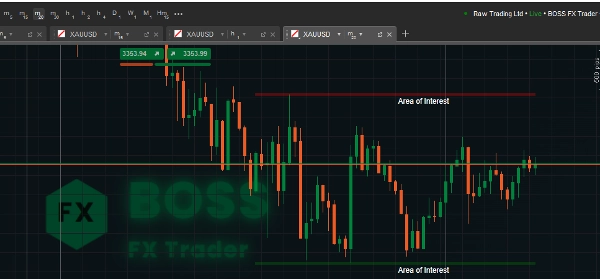
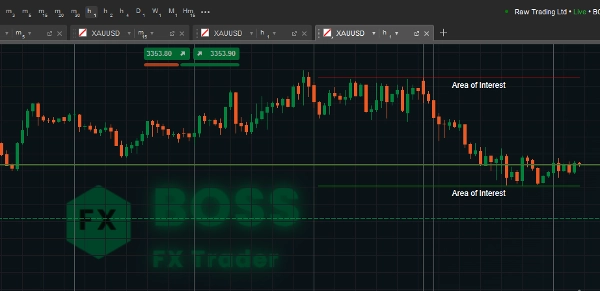
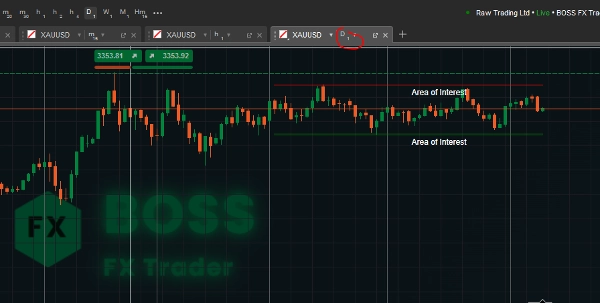
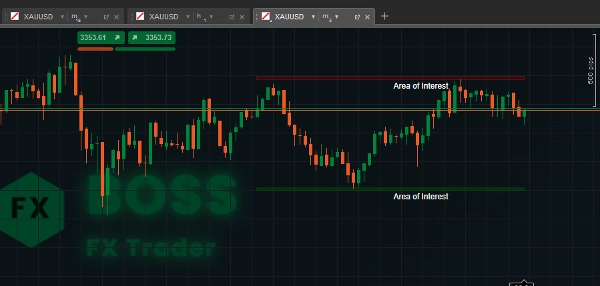
Questo Area di Interesse indicatore cTrader identifica zone di supporto e resistenza all'interno di un periodo di lookback definito dall'utente, e le evidenzia visivamente come “Aree di Interesse” sul tuo grafico.
Aiuta i trader a vedere rapidamente i livelli chiave di prezzo dove è più probabile che si verifichino inversioni o breakout.
2. Come Funziona il Codice
- Periodo di Lookback – Il numero di barre (candele) precedenti che l'indicatore esaminerà per trovare il massimo più alto e il minimo più basso.
- Valori più alti → zone più ampie.
- Valori più bassi → livelli più recenti.
- Altezza della Zona – La dimensione verticale (spessore) dell'area di supporto/resistenza in pips.
- Aiuta a rendere la zona più visibile e regolabile.
- Pulisce i disegni vecchi prima di tracciarne di nuovi per evitare confusione.
- Raccoglie i prezzi massimi e minimi per l'intervallo di lookback.
- Trova i livelli di prezzo più alti e più bassi (resistenza e supporto).
- Converte l'altezza della zona da pips a valore di prezzo reale.
3. Istruzioni per l'Uso
- Allega l'Indicatore
-
- Apri cTrader, carica un grafico, clicca Indicators → Custom → AreaOfInterest.
- Regola i Parametri
-
- Periodo di Lookback:
-
- Per il swing trading → Usa valori più grandi (es. 100–200).
- Per lo scalping → Usa valori più piccoli (es. 20–50).
- Altezza della Zona: Regola in base al tuo stile di trading e alla volatilità dello strumento.
- Interpretazione delle Zone
-
- Zona Rossa (Resistenza) – Il prezzo tende a invertire o rallentare entrando in questa zona.
- Zona Verde (Supporto) – Il prezzo spesso rimbalza verso l'alto da qui.
- Cerca:
-
- Rifiuto del prezzo
- Pattern di candele (pin bar, engulfing)
- Confluenza con altri indicatori (EMA, RSI, Fibonacci)
- Esempi di Trading
-
- Trade di Rimbalzo: Entra long vicino alla zona verde con uno stop appena sotto di essa.
- Trade di Breakout: Aspetta che i prezzi chiudano sopra la zona rossa per un breakout rialzista.
- Rilevamento di Falsi Break: Osserva le code oltre la zona ma chiuse all'interno (possibili inversioni).
Un trader redditizio ha usato questo strumento.
Riepilogo
Riepilogo AI
Area of Interest is a cTrader indicator designed to identify and visually highlight key support and resistance zones on trading charts. It scans a user-defined lookback period to detect the highest highs and lowest lows, marking these as “Areas of Interest” to help traders recognize price levels where reversals or breakouts are more likely. Users can adjust the lookback period to focus on broader historical zones or more recent price levels, and set the vertical size (zone height) of these areas in pips for better visibility. The indicator clears previous drawings before plotting new zones to maintain chart clarity. Resistance zones are displayed in red, indicating potential price reversals or slowdowns, while support zones appear in green, suggesting possible price bounces. Traders can use these zones alongside price action signals such as candlestick patterns and other technical indicators to inform trading decisions. Typical applications include entering long positions near support zones, trading breakouts above resistance zones, and detecting false breakouts by observing price wicks relative to the zones. The indicator supports customization to suit different trading styles, including scalping and swing trading, by adjusting the lookback period and zone height parameters.
Profilo indicatore
Recensioni dei clienti
4.0
Recensioni: 2
5 | 0 % | |
4 | 100 % | |
3 | 0 % | |
2 | 0 % | |
1 | 0 % |
Discussioni
Domande frequenti
I prodotti disponibili tramite cTrader Store, inclusi bot di trading, indicatori e plugin, sono forniti da sviluppatori terzi e resi disponibili esclusivamente a scopo informativo e di accesso tecnico. cTrader Store non è un broker e non fornisce consulenze in materia di investimento, raccomandazioni individualizzate o garanzie di risultati futuri.


![Logo di "Gaussian Channel [Iridio Capital]"](https://cdn.ctrader.com/image/webp/7c039209-5573-4a54-a072-f9528b503103_41960)
![Logo di "[Hamster-Coder] Pivot Points MTF"](https://cdn.ctrader.com/image/webp/4c143e5a-309c-40e3-a578-f04d1e133ffa_31159)


Prezzo
Da 29/05/2025
3.04M
Volume negoziato
45.22K
Profitto in pip
29
Vendite
768
Installazioni gratuite