

Descrizione
PROFILO DEL VOLUME SWING (SVP)
Profilo del volume basato sullo swing + Fibonacci + RSI
--------------------------------------------------
Rilevamento dello swing. Profilo del volume. Fibonacci. RSI. Tutto in uno.
--------------------------------------------------
COSA FA QUESTO INDICATORE
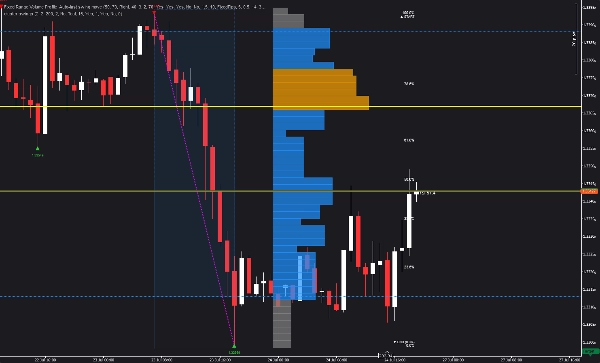
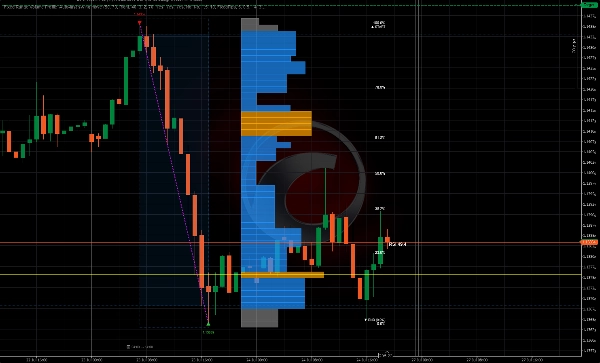
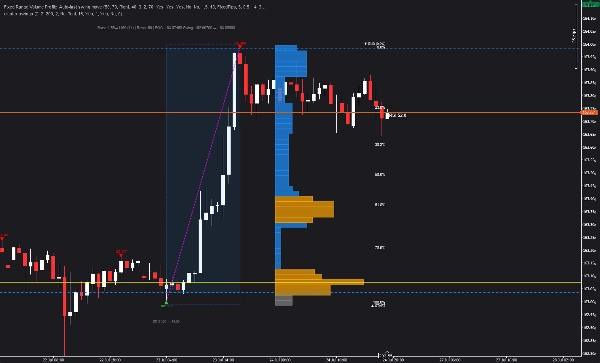
Il Profilo del Volume Swing (SVP) rileva automaticamente gli swing strutturali e mostra un profilo del volume per l'ultimo swing completato — con ritracciamento di Fibonacci e sovrapposizione RSI.
Non è necessaria la selezione manuale dell'intervallo. L'indicatore trova gli swing e costruisce automaticamente il profilo.
--------------------------------------------------
CARATTERISTICHE PRINCIPALI
- RILEVAMENTO AUTOMATICO DEGLI SWING (profondità e deviazione configurabili)
- Profilo del volume per l'ultimo swing completato
- Punto di Controllo (POC) - livello di volume più alto
- Area di Valore (VAH + VAL) - percentuale configurabile
- Nodi ad Alto Volume (HVN) - volume sopra la soglia media
- Ritracciamento di Fibonacci (0, 23.6, 38.2, 50, 61.8, 78.6, 100)
- Sovrapposizione RSI vicino al prezzo corrente
- Posizionamento dell'istogramma: Sinistra, Destra o Vicino alle Barre
- Righe configurabili (da 10 a 200)
- Colori e opacità personalizzabili
- Estendi le linee verso destra
- Mostra/nascondi etichette dei prezzi
- Nessun repainting
--------------------------------------------------
COME FUNZIONA
1. L'indicatore rileva gli swing usando profondità e deviazione configurabili
2. Viene identificato l'ultimo swing completato
3. Il profilo del volume viene calcolato dall'intervallo dello swing
4. Vengono mostrati POC, VAH, VAL, HVN
5. Il ritracciamento di Fibonacci viene sovrapposto allo swing
6. L'RSI corrente viene mostrato vicino al prezzo
Tutto automatico. Nessun input manuale richiesto.
--------------------------------------------------
ELEMENTI VISIVI
- Triangoli rossi verso il basso = Massimi dello swing
- Triangoli verdi verso l'alto = Minimi dello swing
- Linea tratteggiata magenta = Connessione dello swing
- Linea orizzontale gialla = Punto di Controllo (POC)
- Linee tratteggiate blu = Valore Area High (VAH) e Valore Area Low (VAL)
- Barre arancioni = Nodi ad Alto Volume (HVN)
- Barre grigie = Nodi a basso volume
- Linee orizzontali dorate = Livelli di Fibonacci
- Etichette bianche = Percentuali di Fibonacci
- Valore RSI = RSI corrente vicino al prezzo
--------------------------------------------------
PANORAMICA DEI PARAMETRI
IMPOSTAZIONI DEL PROFILO:
- Numero di Righe: Quante righe di prezzo (10-200)
- Percentuale Area di Valore: % di volume nell'area di valore (1-100)
IMPOSTAZIONI VISIVE:
- Posizione dell'Istogramma: Destra, Sinistra, Vicino alle Barre, o Vicino alle Barre a Sinistra
- Larghezza Istogramma %: Larghezza delle barre dell'istogramma
- Scala della Larghezza delle Barre: Fattore di scala per la larghezza delle barre
- Larghezza Minima delle Barre %: Larghezza minima delle barre
- Opacità delle Barre: Trasparenza delle barre (10-100)
RILEVAMENTO SWING:
- Profondità dello Swing: Quante barre controllare per estremi locali
- Modalità Deviazione: Pips fissi o basata su ATR
- Deviazione Fissa: Distanza minima in pip tra gli swing
- Moltiplicatore Deviazione ATR: Moltiplicatore per deviazione basata su ATR
- Periodo ATR: Periodo per il calcolo dell'ATR
- Backstep: Barre minime tra gli swing
VISIVO - SWING:
- Mostra Linee Swing: Attiva/disattiva linea swing magenta
- Colore Linea Swing
- Mostra Etichette Swing: Attiva/disattiva etichette prezzo
- Colori Swing Alto/Basso
VISIVO - FIBONACCI:
- Mostra Ritracciamento Fib: Attiva/disattiva sovrapposizione Fibonacci
- Mostra Linee Fib: Attiva/disattiva linee orizzontali
- Mostra Etichette Fib: Attiva/disattiva etichette percentuali
- Colore Linea Fib / Colore Testo Fib
VISIVO - RSI:
- Mostra Valore RSI: Attiva/disattiva sovrapposizione RSI
- Periodo RSI: Periodo per il calcolo RSI
- Colore Etichetta RSI
COLORI:
- Colore POC / Colore Area di Valore / Colore Nodo ad Alto Volume / Colore Volume Basso
--------------------------------------------------
CASI D'USO
- Identificare swing e distribuzione del volume in una sola vista
- Trovare il Punto di Controllo (POC) per ingressi e uscite
- Usare l'Area di Valore (VAH/VAL) per obiettivi di profitto
- Individuare Nodi ad Alto Volume (HVN) per livelli chiave
- Applicare il ritracciamento di Fibonacci allo swing
- Confermare le operazioni con la congiunzione RSI
- Comprendere la distribuzione del volume a colpo d'occhio
--------------------------------------------------
AGGIORNAMENTO A STRUCTURAL HEAT ZONES
Questo indicatore mostra swing e distribuzione del volume.
Structural Heat Zones va oltre — mappa l'intensità di partecipazione, accettazione vs rifiuto e l'impegno del mercato attraverso più zone.
Cerca Structural Heat Zones nel cTrader Store.
--------------------------------------------------
AGGIORNAMENTO A INVICTUS EA
Invictus EA utilizza la tecnologia strutturale per eseguire operazioni automatizzate.
Cerca Invictus nel cTrader Store.
--------------------------------------------------
NOTE TECNICHE
- Indicatore sovrapposto
- Funziona su qualsiasi timeframe e simbolo
- Nessun repainting (calcolo storico)
- Ottimizzato per le prestazioni
--------------------------------------------------
SUPPORTO
Aggiornamenti a vita inclusi.
PER ULTERIORI INFORMAZIONI - Clicca sul Profilo dello Sviluppatore qui sotto.
Riepilogo
The indicator identifies swings using configurable parameters such as swing depth and deviation mode (fixed pips or ATR-based), then computes volume distribution within the swing range without requiring manual range selection. Visual elements include colored markers for swing highs and lows, volume nodes, Fibonacci levels, and RSI values, all customizable in terms of color, opacity, and histogram positioning.
Key features include no repainting, configurable rows for volume profile resolution, extendable lines, and toggleable price labels. Use cases focus on identifying swing structures, volume distribution, key price levels, and confluences for trade entries, exits, and profit targets. The indicator is optimized for performance and provides lifetime updates.





























