
Descrizione
🧠 Cos'è (in pratica)
Questo è un VWAP Dinamico Ancorato allo Swing che si ancora automaticamente all'ultimo pivot di swing significativo (massimo/minimo). Invece di basarsi su ancore di sessione fisse, si adatta alla struttura del mercato e evidenzia continuamente una zona di “valore equo” realistica basata sulla dinamica di prezzo e volume.
🧩 Struttura dello swing (logica del pivot)
Utilizzando il Periodo di Swing, l'indicatore rileva i principali punti di svolta:
- Pivot Alto quando il prezzo forma il massimo più alto all'interno della finestra di lookback
- Pivot Basso quando il prezzo forma il minimo più basso all'interno della finestra di lookback
Quando il pivot attivo cambia, il segmento VWAP viene resettato e riancorato, fornendo un contesto strutturale chiaro.
⚙️ Comportamento adattivo del VWAP (APT + volatilità)
Con Adaptive Price Tracking (APT), il VWAP può essere regolato per essere più stretto o più morbido:
- APT più basso → reazione più veloce (più vicino al prezzo)
- APT più alto → reazione più lenta (vista macro più pulita)
Se è abilitata l'adattamento alla volatilità, l'APT si regola automaticamente usando il rapporto ATR, rendendo l'indicatore più reattivo durante alta volatilità e più morbido in condizioni di calma.
🚦 Come leggerlo (segnali chiave)
✅ Cambio di struttura (cambio di ancora) → potenziale cambio di regime / nuova fase di mercato
✅ Prezzo sopra/sotto il VWAP → filtro di bias rialzista/ribassista
✅ Rottura e retest del VWAP → uno dei setup di conferma più forti
✅ Etichette HH/HL vs LH/LL → qualità del trend e forza di continuazione
✅ Pendenza del VWAP → momentum e salute del mercato
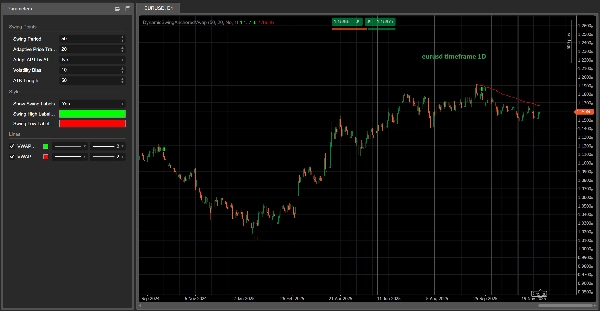
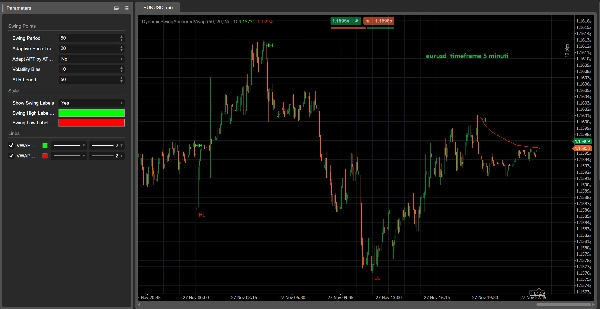
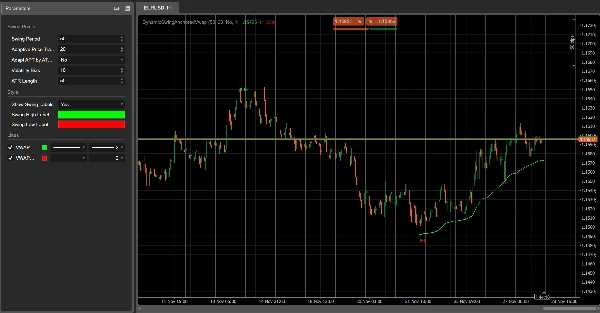
🖼️ Vantaggio multi-timeframe (visibile negli screenshot)
Gli screenshot mostrano chiaramente che, analizzando lo stesso asset su più timeframe, l'indicatore si aggiorna e riallinea agli swing di ogni timeframe—rendendo facile individuare quando i timeframe sono allineati (segnali più forti) o in conflitto (più incertezza/gamma). Questo fornisce un chiaro bias direzionale su dove il mercato ha una probabilità più alta di muoversi successivamente.
📩 Vuoi le migliori prestazioni? Contattaci!
Se vuoi le migliori ottimizzazioni, una regolazione dei parametri su misura per il tuo asset/timeframe, e accesso ai nostri fantastici strumenti di trading, sentiti libero di contattarci — ti aiuteremo a ottenere i segnali più puliti e il setup più efficace per la tua strategia. 🚀
Riepilogo
This indicator features Adaptive Price Tracking (APT), allowing users to adjust the VWAP’s sensitivity for faster or smoother reactions to price changes. When volatility adaptation is enabled, APT automatically adjusts based on the Average True Range (ATR) ratio, enhancing responsiveness during volatile periods and smoothing during calmer markets.
Key signals include detecting structure shifts via anchor changes, price positioning relative to the VWAP for bullish or bearish bias, break and retest patterns of the VWAP as confirmation setups, trend quality through higher highs/lows versus lower highs/lows, and VWAP slope indicating momentum and market health.
The indicator supports multi-timeframe analysis by realigning to each timeframe’s swings, helping identify alignment or conflict across timeframes for clearer directional bias. It is applicable across various markets including Forex, cryptocurrencies, commodities, indices, and stocks.
Recensioni dei clienti
5 | 100 % | |
4 | 0 % | |
3 | 0 % | |
2 | 0 % | |
1 | 0 % |


