
TradingViewMACD
Indikator
3 pembelian
Versi 1.0, Feb 2025
Windows, Mac
5.0
Ulasan: 1

Deskripsi
Indikator TradingViewMACD
Tingkatkan strategi trading Anda dengan indikator TradingViewMACD kami yang sangat dapat disesuaikan, dirancang untuk platform cAlgo. Alat yang kuat ini menggabungkan fleksibilitas dan presisi yang dibutuhkan untuk mengoptimalkan analisis pasar Anda.
Fitur Utama:
- Parameter yang Dapat Disesuaikan:
-
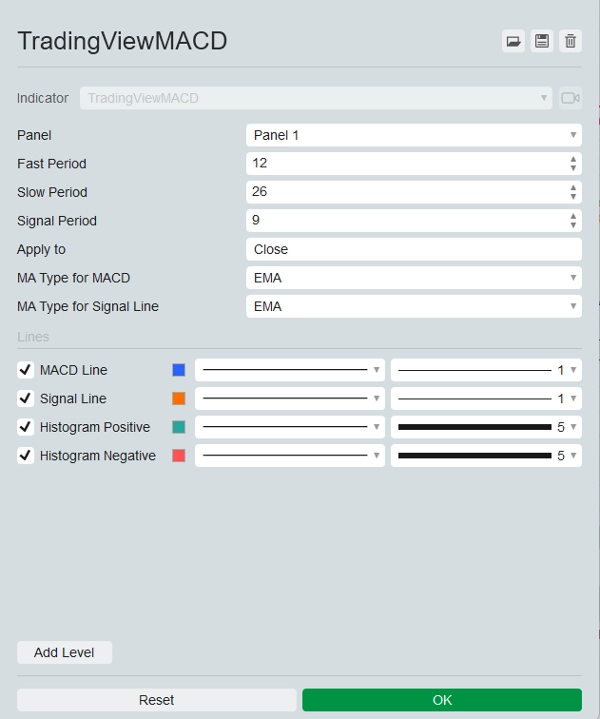
- Periode Cepat: Sesuaikan periode rata-rata bergerak cepat sesuai gaya trading Anda.
- Periode Lambat: Konfigurasikan periode rata-rata bergerak lambat untuk meningkatkan akurasi sinyal.
- Periode Sinyal: Atur periode garis sinyal untuk menyempurnakan titik masuk dan keluar Anda.
- Harga yang Diterapkan: Pilih dari harga buka, tinggi, rendah, tutup, median, tipikal, atau tertimbang untuk menerapkan indikator.
- Berbagai Jenis Rata-Rata Bergerak:
-
- Pilih antara Simple Moving Average (SMA) dan Exponential Moving Average (EMA) untuk garis MACD dan garis sinyal, memberikan fleksibilitas dalam analisis Anda.
- Output Visual:
-
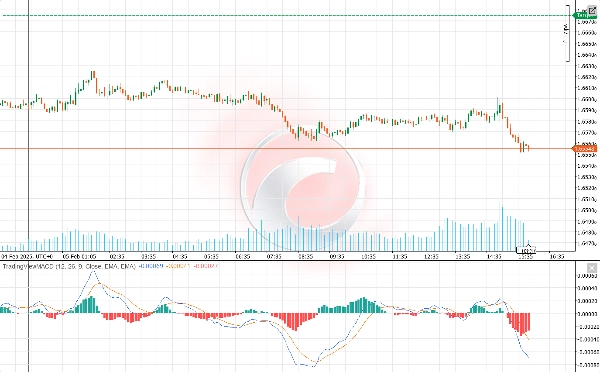
- Garis MACD: Ditampilkan dengan warna biru mencolok untuk visibilitas yang jelas.
- Garis Sinyal: Disorot dengan warna oranye cerah agar mudah dibedakan dari garis MACD.
- Histogram: Membedakan antara nilai positif dan negatif dengan warna hijau dan merah masing-masing, menawarkan representasi visual yang jelas dari momentum pasar.
- Wawasan Pasar yang Ditingkatkan:
-
- Indikator menghitung perbedaan antara rata-rata bergerak cepat dan lambat untuk menghasilkan garis MACD.
- Menghitung garis sinyal sebagai rata-rata bergerak dari garis MACD.
- Histogram secara visual mewakili perbedaan antara garis MACD dan garis sinyal, membantu Anda mengidentifikasi potensi sinyal beli dan jual.
- Mudah Digunakan:
-
- Mudah dipasang dan dikonfigurasi, memungkinkan trader dari semua tingkat untuk memanfaatkan fitur canggihnya.
- Dokumentasi lengkap dan dukungan pelanggan untuk memastikan pengalaman yang lancar.
Manfaatkan potensi penuh strategi trading Anda dengan indikator TradingViewMACD. Tingkatkan analisis pasar Anda, buat keputusan yang tepat, dan tetap unggul dengan alat trading penting ini.
Ringkasan
Ringkasan AI
The TradingViewMACD indicator for the cAlgo platform is a customizable technical analysis tool designed to enhance market analysis. It calculates the difference between fast and slow moving averages to generate the MACD line, computes a signal line as the moving average of the MACD line, and displays a histogram representing the difference between these lines to help identify potential buy and sell signals.
Key features include adjustable parameters such as fast period, slow period, signal period, and applied price (open, high, low, close, median, typical, or weighted). Users can select between Simple Moving Average (SMA) and Exponential Moving Average (EMA) types for both the MACD and signal lines, providing analytical flexibility.
Visual outputs consist of a blue MACD line, an orange signal line, and a histogram with green and red colors indicating positive and negative momentum, respectively. The indicator is designed for ease of installation and configuration, supported by comprehensive documentation and customer support to accommodate traders of all experience levels.
Profil indikator
Ulasan pelanggan
5.0
Ulasan: 1
5 | 100 % | |
4 | 0 % | |
3 | 0 % | |
2 | 0 % | |
1 | 0 % |
Ulasan pelanggan
November 9, 2025
TradingView MACD brings the familiar feel straight to cTrader 🚀 - smooth, light, and 100% accurate to the original. Perfect for traders switching from TV who love clean momentum signals. Missing alerts, but flawless for classic trend and divergence play.
Diskusi
Pertanyaan umum
Signal
MACD
Produk-produk yang tersedia melalui cTrader Store, termasuk bot trading, indikator, dan plugin, disediakan oleh pengembang pihak ketiga serta hanya ditujukan untuk akses teknis dan informasi. cTrader Store bukan broker dan tidak menyediakan saran investasi, rekomendasi pribadi, atau jaminan apa pun tentang kinerja di masa mendatang.


Harga
Sejak 22/11/2024
137
Penjualan
2.61K
Instal gratis