
Описание
ICT Killzones Complete – Профессиональный анализ торговых сессий
Освойте тайминг институциональной торговли с самым полным индикатором ICT Killzones для cTrader. Этот профессиональный инструмент автоматически определяет и визуализирует все пять критических торговых сессий ICT (Inner Circle Trader), давая вам преимущество для торговли вместе с умными деньгами.
Что нового в этой версии:
- Все 5 сессий ICT: Полное покрытие, включая Asian Range, London Kill Zone, New York Kill Zone, NY Lunch/Reversal Zone и NY PM Kill Zone
- Умная цветовая система: Простые названия цветов (Красный, Синий, Оранжевый) вместо сложных ARGB кодов
- Независимый контроль прозрачности: Регулировка непрозрачности для каждой сессии (0-100%)
- Цвета меток для каждой сессии: Настройка цветов меток независимо от цветов зон
- Описание сессий: Опциональные информационные метки, объясняющие характеристики каждой сессии
- Повышенная производительность: Оптимизированный код с автоматической очисткой старых зон
Основные функции:
📊 Полное покрытие сессий:
- Asian Range (19:00-00:00 NY): Определяет зоны консолидации и пулы ликвидности для последующих рейдов
- London Kill Zone (02:00-05:00 NY): Отмечает основные всплески волатильности, идеальные для охоты на стопы и разворотов
- NY Kill Zone (07:00-10:00 NY): Выделяет второе крупное движение с сильным импульсом
- NY Lunch Zone (12:00-13:30 NY): Показывает периоды разворота и консолидации
- NY PM Kill Zone (13:30-16:00 NY): Захватывает вторичные движения и ребалансировку рынка
🎨 Простая настройка цветов:
- Простые названия цветов: просто введите "Синий", "Оранжевый", "Фиолетовый" и т.д.
- Более 50 предустановленных цветов, включая DodgerBlue, BlueViolet, MediumAquamarine
- Поддержка HEX цветов (#RRGGBB формат)
- Индивидуальные ползунки прозрачности (0-100%) для каждой зоны
- Отдельные цвета меток для максимальной ясности
⚙️ Мощные параметры отображения:
- Включение/выключение отдельных сессий
- Показ/скрытие информационных меток сессий
- Регулируемый размер шрифта (6-20)
- Расширение зон до края графика или их ограничение
- Управление количеством дней истории для отображения (1-30 дней)
- Автоматическая очистка предотвращает загромождение графика
🎯 Профессиональный дизайн:
- Чистая, ненавязчивая визуализация
- Динамическое отслеживание максимумов/минимумов во время активных сессий
- Корректная обработка ночных сессий
- Работает на всех таймфреймах
- Отсутствие задержек, оптимизированная производительность
Идеально подходит для:
- Трейдеров, использующих методологию ICT, стремящихся к точному таймингу
- Трейдеров умных денег, следующих за институциональными потоками
- Дейтрейдеров и скальперов, которым нужны точные границы сессий
- Свинг-трейдеров, определяющих ключевые зоны разворота
- Всех, кто хочет согласовать сделки с основными рыночными сессиями
Как это работает:
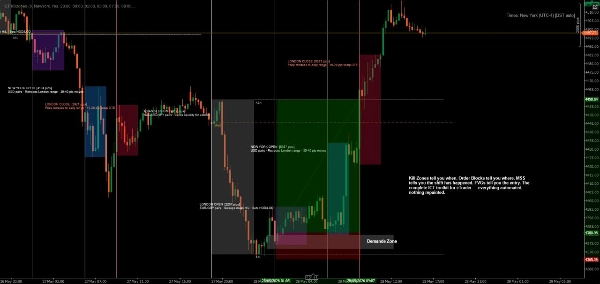
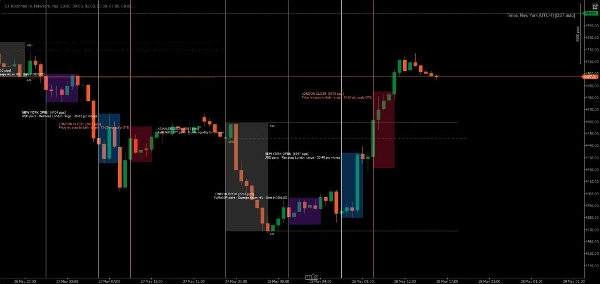
Индикатор автоматически определяет каждый торговый день и создает цветовые зоны для всех пяти сессий ICT. По мере движения цены через каждую сессию индикатор отслеживает максимум и минимум, затем рисует окончательную зону при закрытии сессии. Метки четко идентифицируют каждую сессию и опционально отображают ее торговые характеристики.
Все времена указаны по Нью-Йорку (восточное время), согласно стандартной методологии ICT.
Примеры настройки:
- Консервативная настройка: Низкая прозрачность (20-30%), сдержанные цвета, без информации о сессии
- Яркая настройка: Высокая прозрачность (70-80%), яркие цвета, полные описания сессий
- Минимальная настройка: Отключение ненужных сессий, оставляя только предпочитаемые killzones
- Цветовая стратегия: Соответствие цветов зон вашему торговому настрою (зеленый = лонг, красный = шорт)
Системные требования:
- Платформа: cTrader Desktop (продукты cTrader Store не поддерживаются в веб- или мобильных версиях) blog.ctrader.com
- Операционная система: Windows 7 или выше
- Процессор: Рекомендуется двухъядерный CPU
- Оперативная память: Минимум 2 ГБ ОЗУ (рекомендуется 4 ГБ)
- Интернет-соединение: 50 кБ в секунду или быстрее
Инструкции по установке:
- Покупка/установка: Получите индикатор в cTrader Store
- Скачайте cTrader Desktop: Если еще не установлен, скачайте с ctrader.com
- Вход в систему: Откройте cTrader Desktop и войдите с вашим cTrader ID
- Доступ к индикатору: Перейдите в раздел "Algo" → список "Indicators"
- Добавить на график: Кликните правой кнопкой мыши по любому графику → "Indicators" → выберите "ICT Killzones Complete"
- Настройка: Кликните правой кнопкой мыши по названию индикатора на графике → "Settings" для настройки цветов, времени и параметров отображения
Советы для лучших результатов:
- Используйте таймфреймы от 1 минуты до 1 часа для оптимальной видимости
- Комбинируйте с концепциями ценового действия и ликвидности для лучших результатов
- Настраивайте время сессий, если ваш брокер использует другие часовые пояса
- Экспериментируйте с прозрачностью, чтобы найти идеальный визуальный баланс
- Включайте информационные метки сессий при обучении, отключайте для более чистого графика
Торгуйте с точностью. Торгуйте с уверенностью. Торгуйте по методу ICT.
Примечание: Этот индикатор предназначен для образовательных и информационных целей. Прошлые результаты не гарантируют будущих. Всегда соблюдайте правила управления рисками.
Сводка
The indicator tracks high and low prices during active sessions and finalizes zones upon session close, providing clear visual boundaries for institutional trading timing. It supports all timeframes, handles overnight sessions properly, and includes automatic cleanup of old zones to maintain chart clarity. Customization options include font size adjustment, zone extension control, and history length for displayed zones. ICT Killzones Complete is suitable for traders using ICT methodology, smart money concepts, scalping, day trading, and swing trading across markets such as Forex, commodities, and crypto. It requires cTrader Desktop on Windows 7 or higher with recommended hardware specifications.
Отзывы покупателей
5 | 50 % | |
4 | 25 % | |
3 | 0 % | |
2 | 25 % | |
1 | 0 % |


