
Descripción
https://chartshots.spotware.com/c/695be69b1a3ca
https://chartshots.spotware.com/c/695be2a98e848
https://chartshots.spotware.com/c/695be7e8e88fa
https://chartshots.spotware.com/c/695be31346fe7
https://chartshots.spotware.com/c/695be3bd18aea
https://chartshots.spotware.com/c/695be5d5687c7
Patrones Automáticos de Gráficos
📊 ¿QUÉ ES?
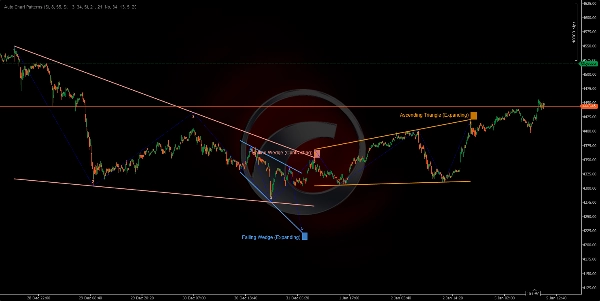
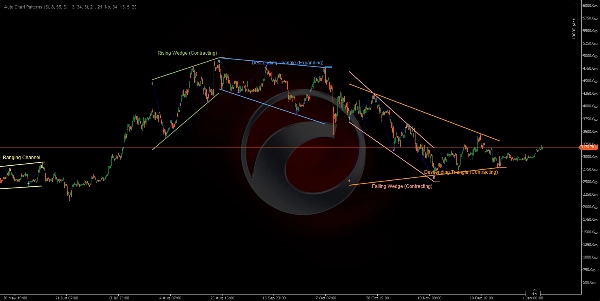
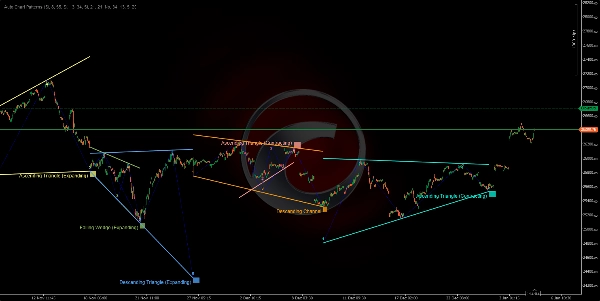
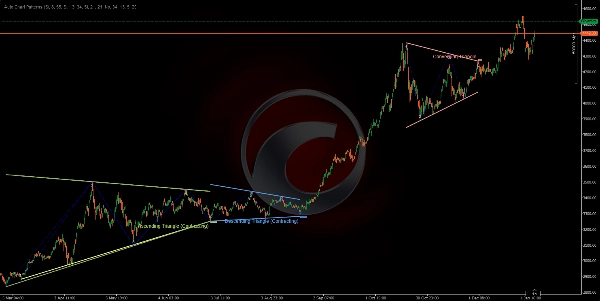
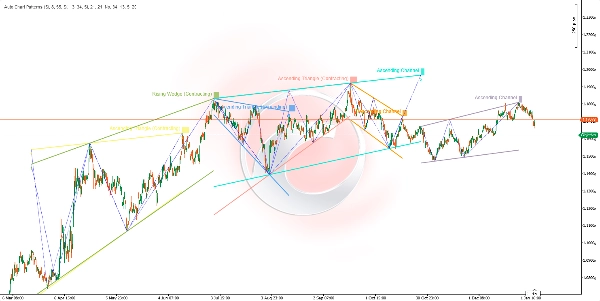
El indicador Patrones Automáticos de Gráficos es un escáner avanzado de formaciones geométricas que detecta y visualiza automáticamente patrones clásicos de gráficos utilizando análisis de puntos de oscilación en múltiples marcos temporales. Identifica 14 formaciones geométricas diferentes incluyendo canales, cuñas y triángulos al conectar máximos y mínimos de oscilación con líneas de tendencia, creando un sistema integral de reconocimiento de patrones.
🎯 ¿PARA QUÉ SIRVE?
Este indicador ayuda a los traders a:
- Detectar automáticamente 14 patrones clásicos de gráficos (canales, cuñas, triángulos) 📐
- Identificar zonas potenciales de ruptura antes de que ocurran ⚡
- Visualizar la estructura del mercado a través de relaciones geométricas de precios 🔍
- Operar patrones de continuación y reversión con confirmación visual ✅
- Filtrar patrones por dirección de tendencia y tipo de pivote final 🎛️
- Analizar múltiples marcos temporales de oscilación simultáneamente para confluencia 🌊
🔍 ¿CÓMO FUNCIONA?
Sistema de Detección de Puntos de Oscilación 📍
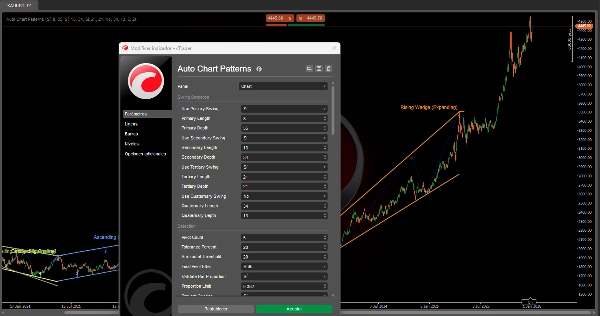
El indicador utiliza hasta cuatro detectores de oscilación independientes que funcionan simultáneamente, cada uno con sensibilidad configurable:
- Lógica de Detección:
-
- Monitorea los máximos y mínimos de precio en una ventana móvil (Período).
- Identifica picos locales (máximos de oscilación) y valles (mínimos de oscilación).
- Confirma oscilaciones solo después de cumplir un requisito mínimo de profundidad (evita ruido).
- Máximo de Oscilación: El precio alcanza el máximo más alto en el Período, luego cae durante
MinDepthbarras. - Mínimo de Oscilación: El precio alcanza el mínimo más bajo en el Período, luego sube durante
MinDepthbarras.
- Cuatro Capas de Oscilación:
-
- Oscilación Primaria (Por defecto: Longitud 8, Profundidad 55) - Estructura a largo plazo 🔵
- Oscilación Secundaria (Por defecto: Longitud 13, Profundidad 34) - Estructura a medio plazo 🟢
- Oscilación Terciaria (Por defecto: Longitud 21, Profundidad 21) - Estructura a corto plazo 🟡
- Oscilación Cuaternaria (Por defecto: Desactivada) - Marco temporal personalizado 🟣
Cada detector puede activarse o desactivarse independientemente para enfocarse en estructuras específicas del mercado.
Proceso de Formación de Patrones 🎨
PASO 1 - RECOLECCIÓN DE PIVOTES:
- El sistema recopila los 5 o 6 puntos de oscilación más recientes de cualquier detector activo.
- Los puntos deben alternar entre máximos y mínimos (estructura zigzag).
- Ejemplo de 5 puntos: Máximo → Mínimo → Máximo → Mínimo → Máximo.
PASO 2 - CONSTRUCCIÓN DE LÍNEAS DE TENDENCIA:
- Separa los pivotes en puntos superiores (máximos de oscilación) y puntos inferiores (mínimos de oscilación).
- Dibuja dos líneas de tendencia: límite superior y límite inferior.
- Para límites de 3 puntos: Prueba 3 combinaciones (0-2, 0-1, 1-2) y selecciona el mejor ajuste ⭐
- Valida que las líneas de tendencia no penetren los cuerpos de las velas (solo se permiten mechas).
- Calcula una puntuación de ajuste: las líneas deben tocar < 20% de las barras entre pivotes.
PASO 3 - ANÁLISIS GEOMÉTRICO:
- Mide la relación angular entre los límites superior e inferior.
- Determina si la formación es Expansiva (ensanchándose), Contractiva (estrechándose), o Paralela (ancho constante).
- Identifica la dirección de la tendencia: Alcista, Bajista o Neutral (horizontal).
- Clasifica en uno de los 14 tipos de formación basados en la geometría.
PASO 4 - VALIDACIÓN Y FILTRADO:
- Verificación de Proporción de Barras: Asegura que el espaciamiento de oscilación sea proporcional (evita patrones distorsionados) ✅
- Prevención de Superposición: Bloquea nuevos patrones que entren en conflicto con los existentes 🚫
- Verificación de Duplicados: Evita redibujar el mismo patrón.
- Filtro de Pivote Final: Solo muestra patrones que terminan con una dirección de pivote especificada (Arriba/Abajo/Ambos).
- Filtro de Tipo de Formación: Habilita/deshabilita categorías específicas de patrones.
PASO 5 - VISUALIZACIÓN:
- Dibuja líneas de límite superior e inferior en colores vibrantes de una paleta de 12 colores 🎨
- Opcionalmente muestra líneas zigzag de oscilación conectando pivotes (azul punteado).
- Muestra números de pivote (1, 2, 3, 4, 5) en cada punto de oscilación.
- Etiqueta la formación con el nombre del patrón en el pivote final.
- Colorea el fondo detrás de la etiqueta para mayor claridad.
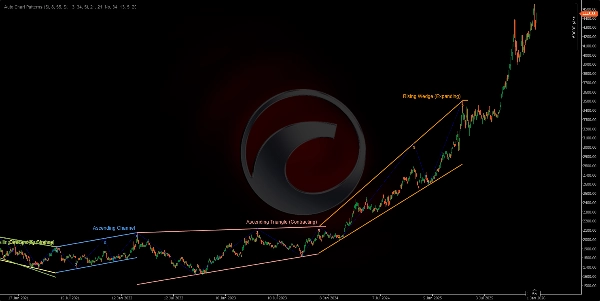
📐 LAS 14 FORMACIONES DETECTADAS
CANALES (Formaciones Paralelas) 📦
- Canal Ascendente (Paralelo Ascendente) 📈
-
- Ambos límites se inclinan hacia arriba en un ángulo similar.
- Indica una tendencia alcista de continuación.
- Operar: Comprar en el límite inferior, vender en el límite superior.
- Canal Descendente (Paralelo Descendente) 📉
-
- Ambos límites se inclinan hacia abajo en un ángulo similar.
- Indica una tendencia bajista de continuación.
- Operar: Vender en el límite superior, comprar en el límite inferior.
- Canal Lateral (Lateral/Horizontal) ↔️
-
- Ambos límites son casi horizontales.
- Indica consolidación o indecisión.
- Operar: Estrategia de rango, comprar en soporte/vender en resistencia.
CUÑAS EXPANSIVAS (Formaciones Ensanchadas) 📣
4. Cuña Ascendente (Expansiva) ⚠️
* Ambos límites se inclinan hacia arriba, con una brecha creciente.
* Patrón de reversión bajista - precio perdiendo impulso alcista.
* Operar: Esperar ruptura del límite inferior, entrar en corto.
5. Cuña Descendente (Expansiva) ⚠️
* Ambos límites se inclinan hacia abajo, con una brecha creciente.
* Patrón de reversión alcista - precio perdiendo impulso bajista.
* Operar: Esperar ruptura del límite superior, entrar en largo.
6. Triángulo Divergente (Triángulo Ensanchado) 🔺
* El límite superior se inclina hacia arriba, el límite inferior hacia abajo.
* Patrón de expansión de alta volatilidad.
* Operar: Extremadamente arriesgado, esperar una ruptura direccional clara.
7. Triángulo Ascendente (Expansivo) 📊
* Límite superior horizontal, límite inferior se inclina hacia arriba.
* Continuación alcista con un rango en expansión.
* Operar: Comprar ruptura del límite superior.
8. Triángulo Descendente (Expansivo) 📊
* Límite inferior horizontal, límite superior se inclina hacia abajo.
* Continuación bajista con un rango en expansión.
* Operar: Vender ruptura del límite inferior.
CUÑAS CONTRACTIVAS (Formaciones Convergentes) 🔻
9. Cuña Ascendente (Contractiva) 🔺
* Ambos límites se inclinan hacia arriba, con una brecha estrechándose.
* Patrón de reversión bajista - agotamiento alcista ⚠️
* Operar: Corto en ruptura del límite inferior.
10. Cuña Descendente (Contractiva) 🔻
* Ambos límites se inclinan hacia abajo, con una brecha estrechándose.
* Patrón de reversión alcista - agotamiento bajista ⚠️
* Operar: Largo en ruptura del límite superior.
TRIÁNGULOS CONTRACTIVOS (Formaciones de Consolidación) △
11. Triángulo Convergente (Triángulo Simétrico) ⚖️
* El límite superior se inclina hacia abajo, el límite inferior hacia arriba a una tasa similar.
* Consolidación neutral - patrón de continuación.
* Operar: Esperar dirección de ruptura, operar en consecuencia.
12. Triángulo Descendente (Contractivo) 📐
* Límite inferior horizontal (soporte), límite superior se inclina hacia abajo.
* Patrón de continuación bajista 🔴
* Operar: Corto en ruptura de soporte con volumen.
13. Triángulo Ascendente (Contractivo) 📐
* Límite superior horizontal (resistencia), límite inferior se inclina hacia arriba.
* Patrón de continuación alcista 🟢
* Operar: Largo en ruptura de resistencia con volumen.
14. Inválido/Desconocido ❌
* Patrones que no cumplen con los criterios geométricos.
* Filtrados automáticamente.
Resumen
Key functionalities include identifying potential breakout zones, visualizing market structure through geometric price relationships, and supporting trading of continuation and reversal patterns with visual confirmation. Users can filter detected patterns by trend direction, pivot type, and formation category. The indicator prevents overlapping and duplicate patterns to maintain clarity.
The 14 detected formations cover a range of classical patterns such as ascending, descending, and ranging channels; expanding and contracting wedges; and various triangle types (converging, diverging, ascending, descending). Visual outputs include color-coded boundary lines, pivot numbering, zigzag swing lines, and labeled pattern names for easy interpretation. This tool supports analysis across multiple markets including Forex, stocks, commodities, indices, and cryptocurrencies.
Valoraciones de clientes
5 | 50 % | |
4 | 50 % | |
3 | 0 % | |
2 | 0 % | |
1 | 0 % |


![Logotipo de "[Stellar Strategies] MARSI Signal Plotter"](https://cdn.ctrader.com/image/webp/7b2b8da6-8f8e-4646-8d4a-4710c516c01e_25567)


