
Descripción
Indicadores de Pinescriptlabs Store: Pinescriptlabs Store cBots : (cBot) Gold & BTC BreakoutSession Pivots(nuevo)
Proyección de Liquidez de Precio ZigZag
Algoritmo Inteligente de Seguimiento (nuevo)
Mapa de Liquidación de Apalancamiento
Predicción Basada en Linreg y ATR
Soporte y Resistencia SmartTrend
Líneas
Sesiones de Brecha de Valor Justo
Análisis
Dinámico de Estructura
de Mercado
de
Puntos
de Giro
Regresión
Lineal
Fibonacci
Multitemporal
Brecha de Valor Justo de Momentum
Proyección de Flujo de Mercado
Gradiente de Tendencia Dinámico
Rastreador de
Sesgo de Velas
Multinivel
Rastreador de Extremos Zig-Zag
Líneas de
Tendencia de Soporte y
Resistencia
Automáticas
Todos
los Niveles de
Soporte y
Resistencia
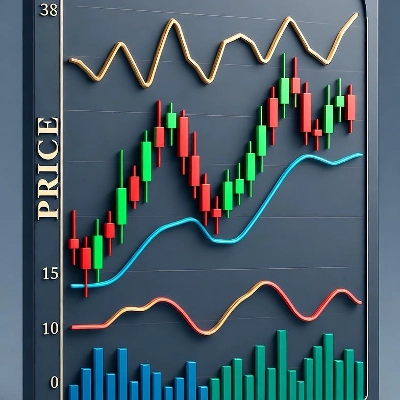
🔥 Mapa de Calor de Volumen POC 🔥
Este indicador es un Perfil de Volumen que muestra la distribución del volumen negociado en diferentes niveles de precio durante un período específico. Su objetivo principal es identificar zonas clave de soporte/resistencia y áreas donde el mercado ha mostrado mayor interés (alta actividad de compra/venta). Es muy útil para:
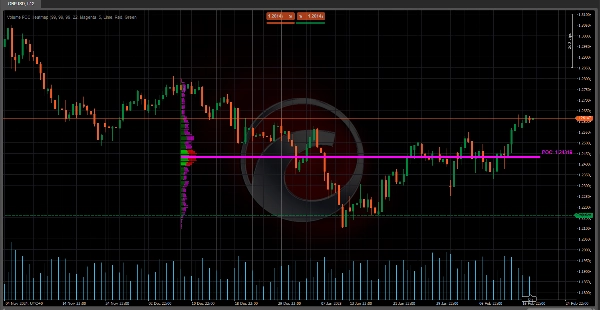
- Detectar el Punto de Control (POC) 🎯
El nivel de precio con el mayor volumen, actuando como un imán para la acción del precio. - Visualizar el Área de Valor (VA)
La zona donde se concentra un porcentaje específico del volumen total (por ejemplo, 70%), indicando equilibrio entre compradores y vendedores. - Diferenciar Volumen Alcista y Bajista 📈📉
Muestra dónde se acumula el poder de compra frente a la presión de venta.
🧠 Lógica y Cálculos Clave 🔢
- División del Rango de Precio 📏
-
- El rango de precio (desde el más bajo hasta el más alto en las últimas B Barras ) se divide en Celdas de Volumen (CNum) .
Ejemplo: Si CNum = 33 , el rango se divide en 33 niveles equidistantes.
- El rango de precio (desde el más bajo hasta el más alto en las últimas B Barras ) se divide en Celdas de Volumen (CNum) .
- Distribución de Volumen por Nivel 📊
-
- Para cada barra en los datos históricos:
-
- Se calcula el volumen asociado con el cuerpo (diferencia entre apertura y cierre) y las mechas (máximos y mínimos).
- El volumen se distribuye proporcionalmente a través de las celdas de precio intersectadas por la barra.
Ejemplo: Si una barra verde (alcista) cubre 3 celdas, el volumen se asigna principalmente a esas celdas como "volumen alcista".
- Cálculo del Punto de Control (POC) 🎯
-
- El POC es la celda con el mayor volumen acumulado, representando el precio donde hubo mayor consenso entre compradores y vendedores.
- Cálculo del Área de Valor (VA) 🔄
-
- Se expande desde el POC hacia arriba/abajo hasta abarcar el % especificado del volumen total (por ejemplo, 70%).
Ejemplo: Si el VA va de 100 a 105 , significa que el 70% del volumen se negoció dentro de ese rango.
- Se expande desde el POC hacia arriba/abajo hasta abarcar el % especificado del volumen total (por ejemplo, 70%).
- Normalización Visual 🖼️
-
- Los volúmenes se escalan usando un Factor de Escala para ajustar el ancho de las barras en el gráfico, facilitando la visualización.
🛠️ Clave del Mapa de Calor de Volumen POC 💡
- Falta de Contexto en Indicadores Tradicionales de Volumen 🤔
Los indicadores clásicos de volumen (como el volumen barra por barra) no muestran dónde se negoció el volumen. Este indicador mapea el volumen por nivel de precio, resolviendo ese problema. - Identificación Orgánica de Soporte/Resistencia 🚀
Las zonas con alto volumen actúan como soporte/resistencia dinámicos, más confiables que líneas estáticas. - Detección de Desequilibrios ⚖️
Áreas con volumen predominantemente alcista o bajista señalan posibles rupturas o reversiones.
💡 Uso Práctico en el Trading 📈
- POC como Zona de Interés 🎯
-
- Si el precio se acerca al POC, se esperan reacciones como rebotes o consolidaciones.
- Área de Valor (VA) como Zona de Equilibrio 🔄
-
- Si el precio está fuera del VA, tiende a regresar a él (efecto magnético).
- Si el precio está dentro del VA, puede indicar consolidación.
- Volumen Alcista/Bajista como Confirmación 🔍
-
- Un pico en volumen alcista en resistencia sugiere una posible ruptura.
- Alto volumen bajista en soporte indica una posible caída.
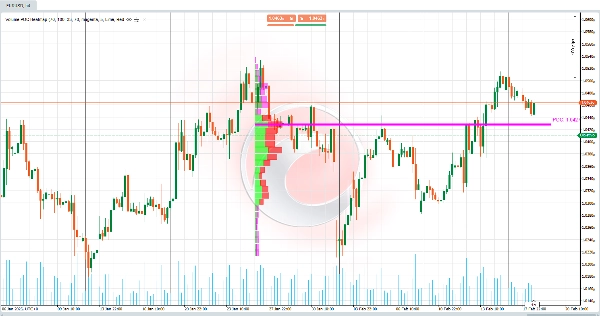
🌟 Ejemplo 📊
Parámetros Usados (Visibles y Configurables por el Usuario):
- Barras Atrás = 55 → Número de barras históricas analizadas.
- Celdas de Volumen = 33 → Número de divisiones/celdas en el rango de precio.
- Porcentaje de Volumen del Área de Valor = 70 → Porcentaje de volumen que define el Área de Valor.
Situación:
- El precio rompe un nivel técnico de soporte, pero el volumen en esa zona es bajo (según el perfil).
- Luego, el precio regresa al Área de Valor (VA) definida por el 70% del volumen total.
Interpretación:
- La ruptura fue falsa (debido al bajo volumen en la zona de ruptura).
- El mercado busca reequilibrarse dentro del Área de Valor , donde hay mayor actividad (alta densidad de volumen).
Acción:
- Buscar oportunidades de compra cerca del límite inferior del VA o del POC, ya que son zonas de alto interés para los participantes del mercado.
Resumen
Key functionalities include:
- Division of the price range into multiple volume cells for detailed volume mapping.
- Calculation of POC as the volume consensus price.
- Determination of the Value Area around the POC.
- Visual normalization of volume bars for clearer chart representation.
This tool addresses the limitation of traditional volume indicators by showing where volume was traded rather than just total volume per bar. It helps identify dynamic support and resistance zones based on volume concentration and detects volume imbalances that may signal potential breakouts or reversals. Traders can use it to anticipate price reactions near the POC and VA, aiding in decision-making for entries and exits. Configurable parameters include the number of historical bars analyzed, volume cells, and the percentage defining the Value Area.
Valoraciones de clientes
5 | 100 % | |
4 | 0 % | |
3 | 0 % | |
2 | 0 % | |
1 | 0 % |