Descripción
🚀 Más de 10,000 traders ya usan nuestros indicadores TOP🏆
Descubre por qué los profesionales nos eligen – las herramientas más poderosas en cTrader (indicadores, algoritmos y cBots) te están esperando.
👉 Obtén todos nuestros sistemas TOP aquí:
_______________________________________________
_______________________________________________
📌 Indicadores de Estructura de Mercado
· ✅ AdvancedMarket Structure: Bos, Choch, SwinLevels, Order Blocks, Market Structure& Liquidity Finder
· 🔄 Análisis Dinámico de Estructura de Mercado de Puntos de Giro
· 🧱 Bloque de Orden
· ⛓️ BOS & CHOCH
· 🧠 ICT Poder de 3
· 🌀 Zonas de Polaridad de Mercado
______________________________________________________________-
Tienda cBots : 🧠 Gold & BTC BreakoutPivotes de Sesión 🧠
_______________________________________________
🔚 Sistemas de Salida Inteligentes
· 📍 Algoritmo Inteligente de Seguimiento
_______________________________________________
📐 Indicadores ZigZag
· 🔍 Proyección de Liquidez de Precio ZigZag
· ➖ ZigZag
· 🎯 Rastreador de Extremos Zig-Zag
_______________________________________________
🧱 Indicadores de Soporte y Resistencia
· 🟩 Líneas de Soporte y Resistencia SmartTrend
· 🧱 Todos los Niveles de Soporte y Resistencia
_______________________________________________
📊 Indicadores de Tendencia y Canal
· 🔄 Canal de Tendencia Automático
· 📊 Supertrend
· ⚡Analizador de Tendencia Momentum
· 🧠 Canal de Tendencia Adaptativo
· 💥 Sistema de Ruptura de Canal
· 🌈 Gradiente Dinámico de Tendencia
_______________________________________________
💧 Herramientas de Volumen y Liquidez
· 🔥 Mapa de Calor POC de Volumen
· 📉 Mapa de Liquidación por Apalancamiento
· 🔍 Brecha de Valor Justo Momentum
· 🕒 Sesiones de Brecha de Valor Justo
_______________________________________________
⚡ Indicadores de Momentum y RSI
· 📈 Disparador de Tendencia RSI
· 🚀 Momentum de Rango Dinámico
· 🔎 Rastreador de Sesgo de Vela Multi-Nivel
_______________________________________________
🔮 Herramientas de Predicción y Proyección
· 📐 Predicción Basada en Linreg& ATR
· 📏 Regresión Lineal Fibonacci Multi-temporal
· 📈 Proyector de Flujo de Mercado Potenciado por Volumen
_________________________________________________________________________________
_________________________________________________________________________________
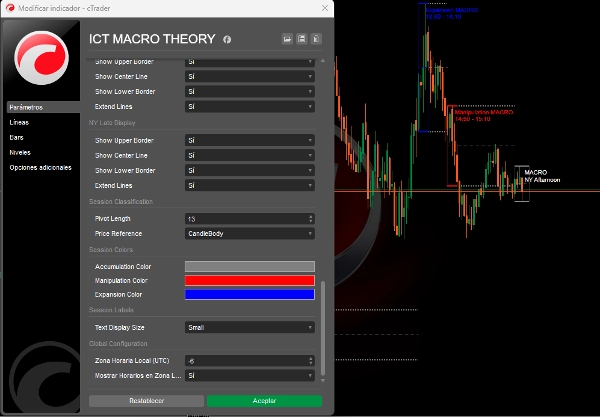
🌐 TEORÍA MACRO ICT
⚠️ NOTA IMPORTANTE: Este indicador solo funciona en marcos temporales inferiores a 5 minutos.
Explicación de los Períodos Macro ICT
Los períodos macro ICT son esencialmente intervalos cortos durante los cuales el algoritmo busca liquidez o ajusta el precio para brechas de valor justo. La base de estos macros ICT radica en la teoría de tiempo y precio de ICT.
Un macro es "una serie corta de instrucciones que crea un evento en la entrega del precio", según la definición del propio ICT.
Los macros ICT no son estrategias de trading completas, pero pueden añadir confluencia a tus operaciones y maximizar ganancias. Ocurren durante las sesiones de Londres, Nueva York, mediodía y tarde.
🔮 Implementación Avanzada de la Teoría de Tiempos Macro ICT:
Conexión Directa con Conceptos ICT:
El código implementa exactamente los 3 tipos de macros ICT descritos en la teoría, usando lógica de clasificación basada en:
- Análisis de Estructura de Mercado:
-
- Detección de Sesiones Macro
- Registra los tiempos exactos de ICT (Londres 02:33, NY 09:50, etc.).
- Detecta cambios estructurales antes y durante cada sesión macro.
- Clasifica automáticamente en:
-
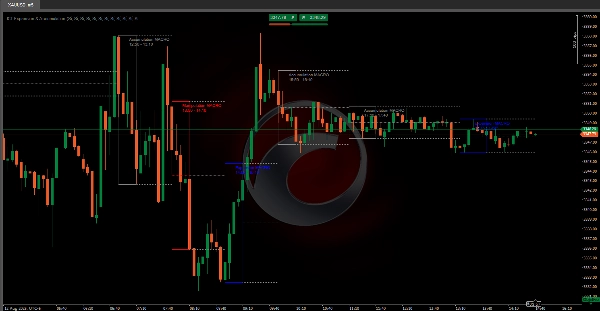
- 🟥 Manipulación: Cuando el precio barre la liquidez en ambos lados (compra/venta).
- 🟦 Expansión: Movimientos direccionales que toman liquidez de un lado (alineados con la tendencia).
- 🟩 Acumulación: Rango estrecho donde el precio "acumula" liquidez.
- Niveles Clave Extendidos:
-
- Dibuja máximos/mínimos de cada sesión macro.
- Calcula y extiende el precio promedio (punto medio) a la siguiente sesión.
- Estos niveles actúan como soporte/resistencia dinámicos (¡Esencial en ICT!).
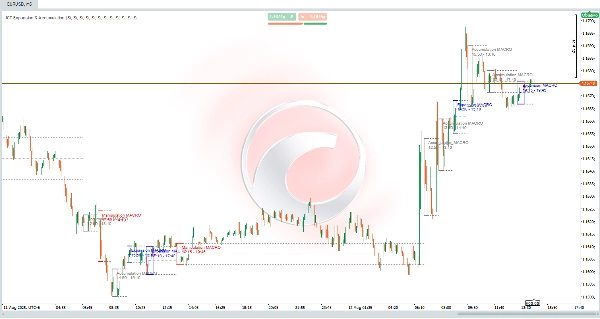
- Detección de Liquidez en Tiempo Real:
-
- Utiliza datos de 1 minuto para identificar pivotes exactos (igual que en marcos temporales inferiores).
Mejoras y Actualizaciones Próximas:
- Detección de Barridos de Liquidez: Identificará barridos de liquidez previos (máximos/mínimos del día/semana anterior).
- Brechas de Valor Justo (FVG): Detectará y visualizará brechas de valor justo.
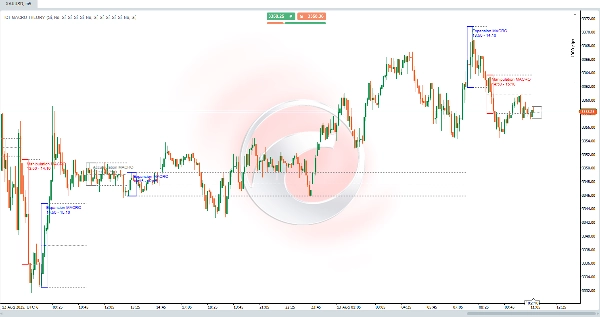
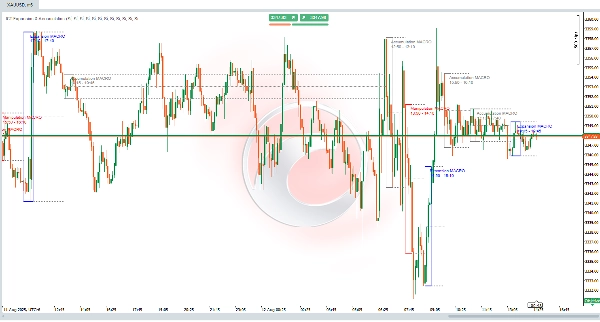
📊 Ejemplo Práctico ICT
Escenario de Apertura NY (09:50-10:10):
- Pre-sesión: El precio barre la liquidez del lado de compra (mínimo local).
- Durante la sesión:
-
- Clasificado como 🟥 MANIPULACIÓN.
- El precio cambia a estructura bajista.
- Post-sesión:
-
- Las líneas extendidas marcan resistencia en los máximos de la sesión.
- Rechazo de la operación en zona con RR 1:3.
✅ Fiel al Principio ICT:
"Los macros no son estrategias completas pero añaden confluencia al identificar dónde los algoritmos buscarán liquidez."
Resumen
The indicator analyzes market structure and detects key macro sessions—London, New York, midday, and afternoon—recording exact ICT times. It classifies price behavior into three types of macros: Manipulation (price sweeps liquidity on both sides), Expansion (directional movement aligned with trend), and Accumulation (tight range where price accumulates liquidity). It also draws and extends session highs, lows, and average price levels to act as dynamic support and resistance.
Using 1-minute data, ICT MACRO THEORY detects precise pivots for real-time liquidity identification. While not a complete trading strategy, it adds confluence to trades by highlighting where algorithms seek liquidity. Planned updates include detection of liquidity sweeps and visualization of fair value gaps.
This tool is intended for traders seeking to incorporate ICT macro time concepts into their analysis for enhanced market structure insight and liquidity detection on very short timeframes.


![Logotipo de "[Stellar Strategies] Market Regime Filter"](https://cdn.ctrader.com/image/webp/3bdeba11-7e8b-4e5f-9af9-d562f48df039_28423)