Descripción
Indicadores de Pinescriptlabs Store: Pinescriptlabs Store cBots : (cBot) Gold & BTC BreakoutSession Pivots(nuevo)
Trailing Smart Algorithm(Nuevo)
Mapa de Liquidación de Apalancamiento
Predicción Basada en Linreg & ATR
Soporte y Resistencia SmartTrend
Líneas
Lines
Sesiones de Brecha de Valor Justo
Análisis
Dinámico de
Estructura de Mercado
de
Puntos
de Giro
Regresión
Lineal
Fibonacci
Multitemporal
Brecha de Valor Justo de Momentum
Proyección de Flujo de Mercado
Gradiente de Tendencia Dinámico
Rastreador de
Sesgo de Velas
Multinivel
Rastreador de Extremos Zig-Zag
Líneas de
Soporte y
Resistencia
de Tendencia
Lines
Todos
los Niveles de
Soporte y
Resistencia
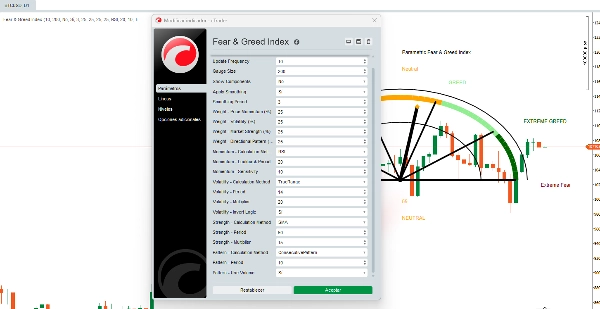
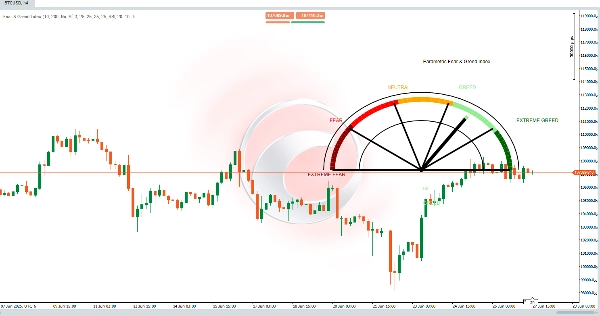
Índice de Miedo y Codicia
El índice de Miedo y Codicia es un algoritmo visual avanzado que sintetiza el sentimiento del mercado en un valor de 0-100 usando un medidor semicircular. A diferencia de las versiones básicas, esta herramienta es totalmente personalizable, permitiendo a los traders ajustar cada aspecto de su cálculo.
📊 Los 4 Componentes Principales (Configurables)
1️⃣ Momentum de Precio *(Peso Configurable: 0-100%)*
6 Métodos de Cálculo Disponibles:
- Cambio de Precio: Cambio % simple vs. período anterior
- ROC: Tasa de Cambio Normalizada
- RSI: RSI modificado para momentum
- Desviación SMA: Desviación del precio respecto a SMA
- Desviación EMA: Desviación del precio respecto a EMA
- MACD: Señal MACD como indicador de momentum
🔧 Parámetros Personalizables:
- Periodo de retrospección *(5-100)*
- Sensibilidad del cálculo *(1.0-50.0)*
2️⃣ Volatilidad *(Peso Configurable: 0-100%)*
6 Métodos de Cálculo Disponibles:
- Rango Verdadero: Volatilidad basada en Rango Verdadero
- Rango Alto-Bajo: Rango simple Alto-Bajo
- Cierre a Cierre: Volatilidad logarítmica cierre a cierre
- ATR: Rango Verdadero Promedio estándar
- Desviación Estándar: Desviación estándar del precio
- Volatilidad Parkinson: Estimador de volatilidad Parkinson
🔧 Parámetros Personalizables:
- Periodo de cálculo *(5-50)*
- Multiplicador de volatilidad *(1.0-100.0)*
- Inversión lógica (mayor volatilidad = más miedo)
3️⃣ Fuerza del Mercado *(Peso Configurable: 0-100%)*
6 Métodos de Cálculo Disponibles:
- SMA: Posición relativa a la Media Móvil Simple
- EMA: Posición relativa a la Media Móvil Exponencial
- VWAP: Posición relativa al Precio Medio Ponderado por Volumen
- Banda Alto-Bajo: Posición dentro de la banda Alto-Bajo
- Posición Bollinger: Posición dentro de las Bandas de Bollinger
- Distancia al Pivote: Distancia a los puntos pivote
🔧 Parámetros Personalizables:
- Periodo de cálculo *(10-200)*
- Multiplicador de fuerza *(1.0-50.0)*
4️⃣ Patrón Direccional *(Peso Configurable: 0-100%)*
6 Métodos de Cálculo Disponibles:
- Ratio Toro-Oso: Ratio de velas alcistas/bajistas
- Patrón de Volumen: Análisis de tendencia de volumen
- Patrón de Tamaño de Cuerpo: Análisis del tamaño del cuerpo de la vela
- Patrón de Mecha: Análisis del patrón de mechas
- Patrón de Gap: Detección y análisis de gaps
- Patrón Consecutivo: Análisis de movimientos consecutivos de precio
🔧 Parámetros Personalizables:
- Periodo de análisis *(5-30)*
- Uso de volumen en cálculos (opcional)
⚙️ Funciones Avanzadas
🔹 Sistema de Ponderación Flexible
- Pesos personalizados por componente *(0-100%)*
- Auto-normalización si los pesos no suman 100%
- Advertencias para configuraciones subóptimas
🔹 Suavizado Inteligente
- Suavizado opcional para reducir ruido
- Periodo de suavizado ajustable *(1-10)*
- Filtro SMA aplicado a resultados finales
🔹 Visualización Totalmente Personalizable
- Tamaño del medidor *(50-500px)*
- Frecuencia de actualización *(1-50 barras)*
- Desglose opcional de componentes (muestra valores individuales)
- Se adapta automáticamente al instrumento y marco temporal
🔄 Proceso del Algoritmo
Paso 4: Visualización
El medidor semicircular muestra 5 zonas de color:
- 0-20: Miedo Extremo
- 21-40: Miedo
- 41-60: Neutral
- 61-80: Codicia
- 81-100: Codicia Extrema
✅ Sistema Totalmente Personalizable:
🎯 Flexibilidad Total
- Se adapta a cualquier mercado: Forex, Cripto, Acciones, Commodities
- Específico para marco temporal: Configuraciones diferentes para scalping vs. swing trading
- Evoluciona con el mercado: Ajusta estrategias conforme cambian las condiciones
Resumen
Valoraciones de clientes
5 | 100 % | |
4 | 0 % | |
3 | 0 % | |
2 | 0 % | |
1 | 0 % |


![Logotipo de "High-Low Divergence [Iridio Capital]"](https://cdn.ctrader.com/image/webp/443c4661-7abb-40f1-842f-4b6ec560649b_40914)