
Descripción
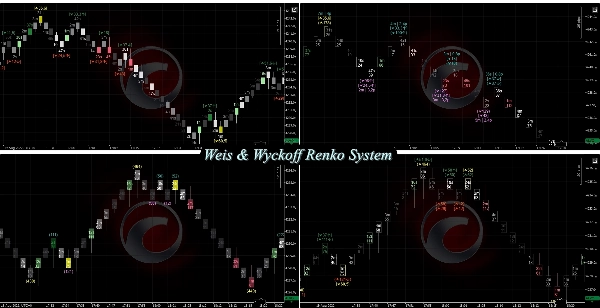
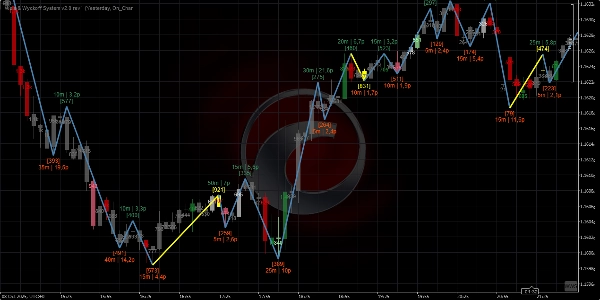
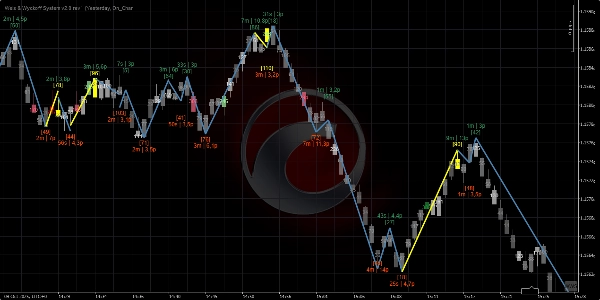
Sistema Weis & Wyckoff ahora soporta ¡cualquier gráfico! [Velas, Tick, Renko, Rango, Heikin-Ash]
Última descripción -> 11/11/2025
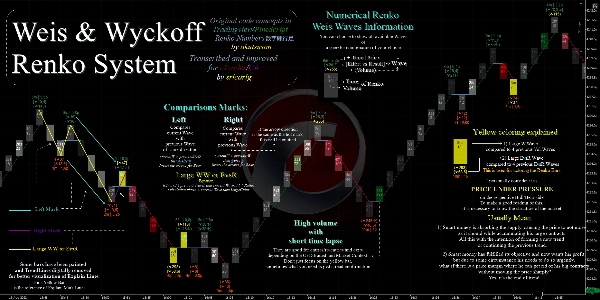
El Sistema Weis & Wyckoff presenta los conceptos de David H. Weis y Richard Wyckoff
¿Qué hay de nuevo en la Revisión 1?
- Soporte para gráficos [Velas, Heikin-Ash, Tick, Rango]
- Mejora en ZigZag => soporte MTF + modos [ATR, Porcentaje, Pips, NoLag_HighLow]
- Incluye todas las mejoras relacionadas con "Order Flow Aggregated"
-
- MAs personalizados
- Dibujo de rendimiento
- Filtros de fuerza (MA/StdDev/Ambos)
- VP_Tick() de alto rendimiento
- GetWicks() de alto rendimiento
- Recolección asíncrona de datos Tick
- Corrección => Panel de parámetros en MacOS
==========================
Es solo una forma de visualizar las Ondas y el Volumen numéricamente, no es una idea original.
Puedes encontrar esta forma de visualización primero en:
- David Weis sobre Wyckoff | Soporte/Resistencia | y Ondas,
- Weis sobre gráficos Renko Wyckoff - Linda Raschke (más reciente)
Esto usa los conceptos de código de:
- (Numbers-Renko 数字練行足 en PineScript),
- Saludos a akutsusho!.
Yo lo mejoré y lo llevé a cTrader/C# y también es gratuito/de código abierto.
=========================================
Transcrito y mejorado para cTrader/C#
por srlcarlg
Conceptos de código original en TradingView/Pinescript
por akutsusho
=========================================
Siempre prefiera la versión de la tienda de cTrader, es la que se actualiza primero.
Todos los indicadores que he desarrollado son de código abierto. Si no tienes acceso al código, revisa el repositorio de Github
Resumen
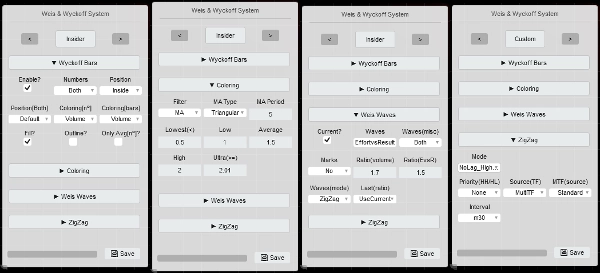
Key features include:
- A versatile Params Panel with four layout templates (Insider, Time, Volume, BigBrain) for quick and user-friendly customization.
- Enhanced ZigZag functionality with multi-timeframe support and multiple modes such as ATR, Percentage, Pips, and NoLag High/Low.
- Integration of order flow aggregation improvements, including custom moving averages, performance drawing, strength filters (MA, StdDev, or both), and high-performance tick volume and wick calculations.
- Dynamic TimeLapse feature showing time waves across various intervals from milliseconds to days.
- Compatibility with Mac OS and requires .NET 6.0 or higher.
The indicator is a C# adaptation and improvement of original PineScript concepts, designed to provide detailed wave and volume visualization without repainting options. It is maintained as open source, with code available on GitHub for transparency and further development.
Valoraciones de clientes
5 | 100 % | |
4 | 0 % | |
3 | 0 % | |
2 | 0 % | |
1 | 0 % |


![Logotipo de "[Stellar Strategies] Moving Averages Combined 1.0"](https://cdn.ctrader.com/image/webp/93692c9d-ac16-4dd8-ba83-5a62250c39a9_27250)


