
E7 Harmonic Structures Basic
Indicateur
647 téléchargements
Version 1.0, Feb 2025
Windows, Mac
5.0
Avis : 2
Description
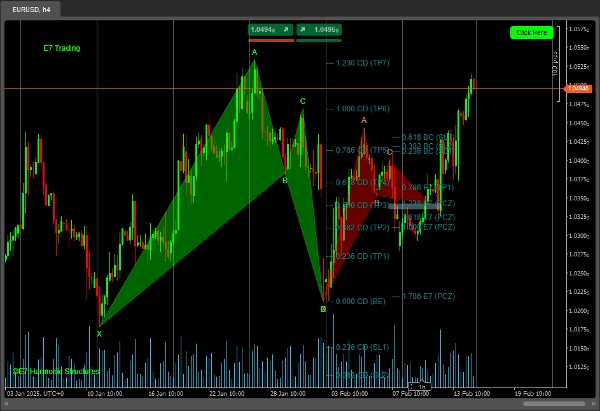
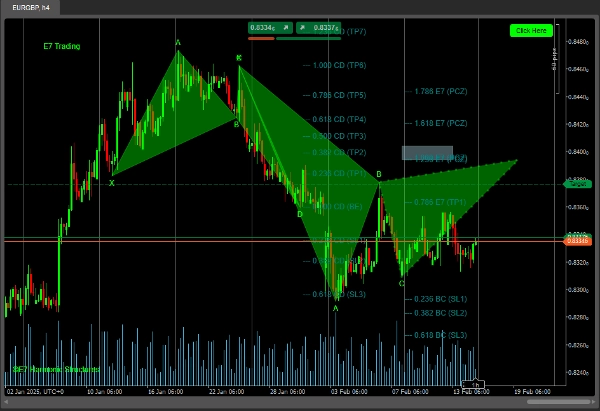
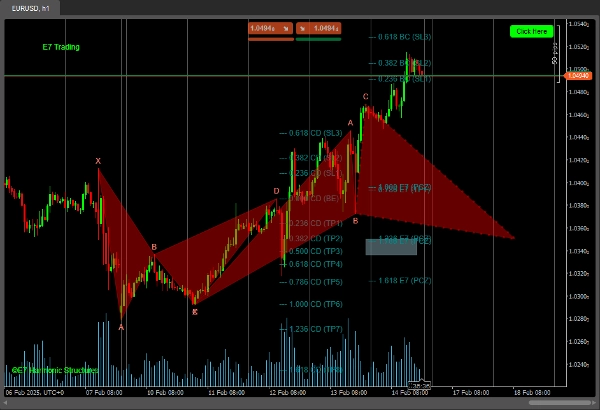
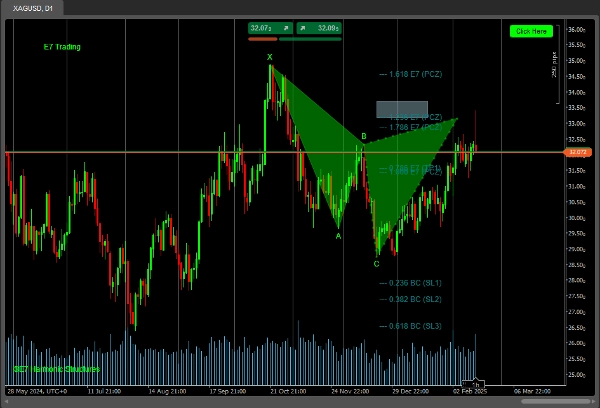
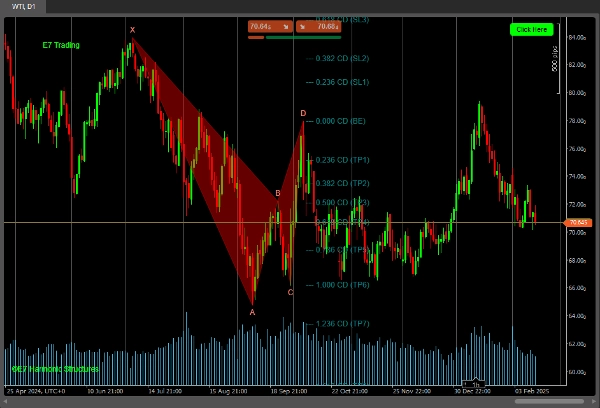
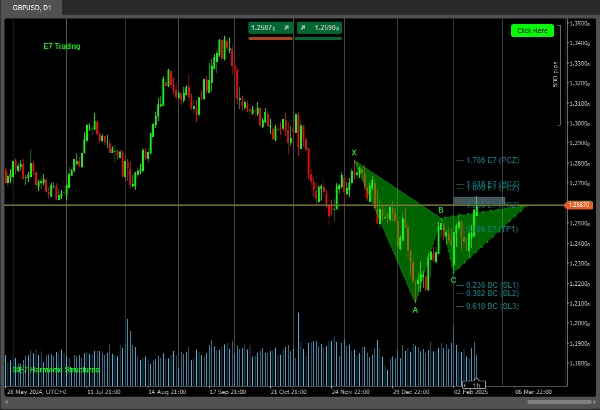
L'indicateur de base E7 Harmonic Structures comprend les éléments suivants :
Structures du point 'C' et structures du point 'D'.
Projections Fib, PCZ et PRZ pour une meilleure analyse, comme enseigné dans les stratégies E7.
Cependant, il inclut seulement un nombre limité des structures suivantes :
- Gartley
- Bat
- Butterfly
- Crab
- Cypher
* Ceci est une version Beta.
L'indicateur complet comprend beaucoup plus de structures et arrive bientôt.
Bonne chasse !
Résumé
Résumé IA
E7 Harmonic Structures Basic is a technical indicator designed for harmonic pattern analysis in trading. It identifies Point 'C' and Point 'D' structures and incorporates Fibonacci projections, Potential Completion Zones (PCZ), and Potential Reversal Zones (PRZ) to support detailed market analysis as outlined in E7 Strategies. The indicator currently detects a limited set of harmonic patterns, including Gartley, Bat, Butterfly, Crab, and Cypher formations. This version is labeled as Beta, with a more comprehensive version including additional structures planned for future release.
Profil de l'indicateur
Avis clients
5.0
Avis : 2
5 | 100 % | |
4 | 0 % | |
3 | 0 % | |
2 | 0 % | |
1 | 0 % |
Avis clients
August 12, 2025
Pros: Detects Bat, Gartley, Butterfly, Shark patterns automatically with PRZ visualization. Flexible settings. Cons: No tooltips or alerts. Missing pattern history log and template saving. Requires external confirmation (volume or PA).
April 22, 2025
I am currently testing your indicator and I must say it is very interesting. I am a fan of Fibonacci and today, April 22, 2025, it showed two beautiful structures on gold. Like from a book about trading. Best regards and I wish you continued success in improving the product. Artur
Discussion
Questions fréquentes
Les produits disponibles sur cTrader Store, notamment les bots de trading, les indicateurs et les plug-ins, sont fournis par des développeurs tiers et mis à disposition à titre informatif et à des fins d'accès technique uniquement. cTrader Store n'est pas un courtier et ne fournit aucun conseil en investissement, aucune recommandation personnelle ni aucune garantie quant aux performances futures.
Plus de cet auteur


Prix
Depuis le 18/12/2024
2
Ventes
4.26K
Installations gratuites