
Description
Camarilla par Bullitt Traders — Visualisez la structure. Négociez avec précision.
Un indicateur pivot Camarilla de qualité professionnelle pour cTrader, conçu pour révéler comment le prix réagit autour des niveaux institutionnels.
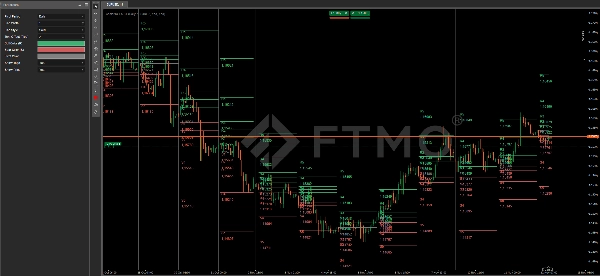
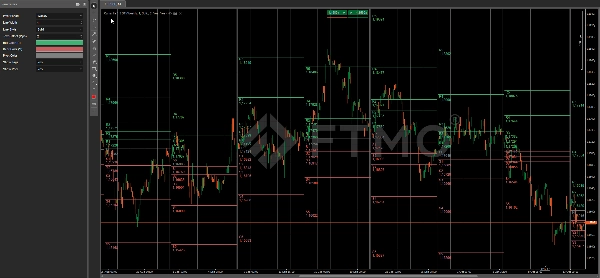
Il trace automatiquement tous les niveaux clés Camarilla (R1–R5 / S1–S5) et les points pivots sur plusieurs périodes — offrant aux traders une carte structurelle claire pour les retournements et les cassures.
Principales caractéristiques
- ✅ Formule Camarilla authentique — calcule les niveaux à partir du plus haut, plus bas et de la clôture de la période précédente.
- 📊 Logique Multi-TF — choisissez entre les périodes pivot Quotidienne, Hebdomadaire ou Mensuelle.
- 🕒 Cartographie historique — dessine automatiquement les périodes passées pour un contexte visuel et une analyse structurelle.
- 🎨 Style personnalisé — ajustez la largeur, le style et la couleur des lignes selon le régime (haussier, baissier, neutre).
- 💬 Étiquettes & prix — activez ou désactivez l’affichage du texte et des valeurs pour une présentation épurée ou détaillée.
- ⚡ Léger & non-repeint — optimisé pour la rapidité et la précision sur n’importe quel symbole.
- 🧩 Compatible avec tous les types de graphiques — compatible temps, plage, tick et Renko.
Niveaux Camarilla
R5 – Zone cible de cassure extrême
R4 – Résistance majeure, déclencheur potentiel de cassure
R3 – Zone de retournement supérieure, souvent utilisée pour les entrées courtes
R2 – Résistance de niveau moyen
R1 – Résistance initiale, niveau de réaction précoce
PP – Point pivot central (zone de moyenne-réversion)
S1 – Support initial, niveau de réaction précoce
S2 – Support de niveau moyen
S3 – Zone de retournement inférieure, souvent utilisée pour les entrées longues
S4 – Support majeur, déclencheur potentiel de cassure
S5 – Zone cible de cassure extrême
Paramètres
Période pivot – choisissez Quotidienne, Hebdomadaire ou Mensuelle pour le calcul des niveaux
Largeur de ligne – ajustez l’épaisseur globale des lignes
Style de ligne – définissez Solide, Points ou Tirets
Décalage du texte (Pips) – distance entre la ligne et l’étiquette
Couleur haussière (R) – couleur pour les niveaux de résistance (R1–R5)
Couleur baissière (S) – couleur pour les niveaux de support (S1–S5)
Couleur pivot – couleur pour la ligne pivot centrale (PP)
Afficher les étiquettes – afficher ou masquer les noms des niveaux R/S
Afficher le prix – afficher ou masquer les étiquettes de prix numériques
Comment utiliser
Zones R3–S3 → zones typiques de retournement intrajournalier
Niveaux R4–S4 → confirmations de cassure ou de continuation
R5–S5 → cibles de forte volatilité et zones d’épuisement
Résumé
Key features include automatic plotting of historical pivot levels for context, customizable line width, style, and colors for bullish, bearish, and neutral regimes, and options to show or hide level labels and price values. The indicator is lightweight, non-repainting, and compatible with various chart types such as time, range, tick, and Renko charts.
Camarilla levels serve specific roles: R3–S3 zones indicate typical intraday reversal areas; R4–S4 levels suggest breakout or continuation confirmations; and R5–S5 mark extreme breakout targets and high-volatility exhaustion zones. This tool provides a clear structural map to assist traders in identifying potential reversals, breakouts, and target zones across multiple markets including Forex, indices, commodities, cryptocurrencies, and stocks.
Avis clients
5 | 100 % | |
4 | 0 % | |
3 | 0 % | |
2 | 0 % | |
1 | 0 % |


