Описание
Что такое кривая Коппока?
Кривая Коппока — это долгосрочный индикатор импульса, изначально разработанный для определения основных минимумов рынка в индексе S&P 500. Она была создана в 1962 году экономистом Эдвином Коппоком, которого знаменитым образом попросила Епископальная церковь найти возможности для безопасных покупок для их фонда.
Проще говоря, это осциллятор, следующий за трендом, который показывает, когда медвежий рынок, вероятно, достиг дна и начинается новый бычий рынок.
«Секретный ингредиент» (Как это работает)
В отличие от многих индикаторов, которые являются резкими и реактивными, кривая Коппока намеренно медленная. Она рассчитывается путем взятия взвешенного скользящего среднего (WMA) суммы двух различных темпов изменения (ROC).
Коппок = WMA(10) от (ROC(14) + ROC(11))
Логика:
Он измеряет скорость изменения импульса цены за длительные периоды (обычно 11 и 14 месяцев). Сглаживая эти данные с помощью взвешенного среднего, он фильтрует почти весь краткосрочный рыночный шум.
Интересный факт:
По сообщениям, Коппок спрашивал у епископов, сколько времени требуется человеку, чтобы оправиться от горя после потери близкого. Они ответили «от 11 до 14 месяцев». Он применил эти же временные рамки к рынку, исходя из предположения, что психология рынка следует похожему циклу горя и восстановления.
Почему это полезно?
Трейдеры и инвесторы любят кривую Коппока по трем основным причинам:
- Она фильтрует шум: Поскольку она рассчитывается на месячных таймфреймах (традиционно), она игнорирует дневную или даже недельную волатильность. Срабатывает нечасто, но когда это происходит, обычно это значимо.
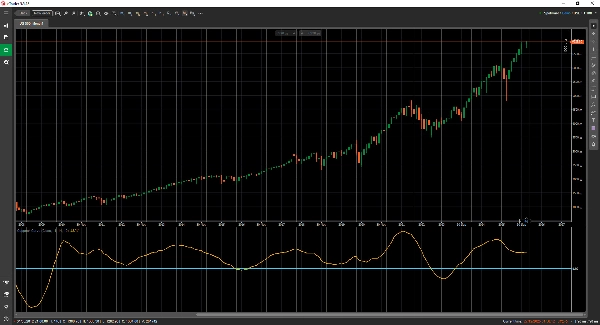
- Четкие сигналы к покупке: Сигнал бинарный и легко читаемый. Сигнал «Купить» генерируется, когда кривая находится ниже нулевой линии и начинает подниматься (начинает расти).
- Психологическая опора: Он предотвращает попытки «поймать падающий нож». Заставляет ждать, пока импульс математически не сменится с отрицательного на положительный, прежде чем входить в позицию.
Когда использовать
- Лучше всего для: Долгосрочного инвестирования, пенсионных распределений и определения начала нового бычьего ралли.
- Не подходит для: Дейтрейдинга или шортинга. Он не предназначен для определения сигналов к продаже или рыночных максимумов.