
AlgoCorner Crosshair Edge
Chỉ báo
Phiên bản 1.0, Apr 2025
Windows, Mac
5.0
Đánh giá: 1
Mô tả
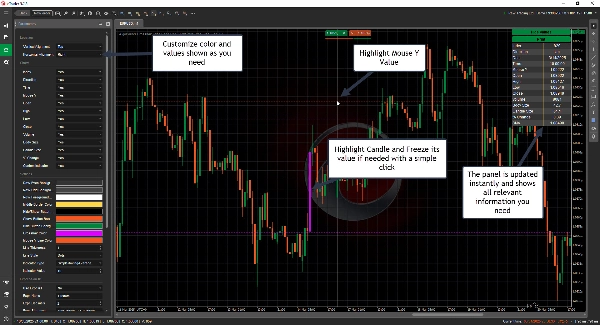
Crosshair Edge: Công cụ trực quan hóa dữ liệu cTrader tốt nhất
Với Crosshair Edge, một công cụ mạnh mẽ cải thiện việc trực quan hóa dữ liệu thị trường bên trong nền tảng cTrader, bạn có thể nâng cao phân tích biểu đồ của mình lên tầm cao mới.
Tương tác biểu đồ nâng cao
- Làm nổi bật thanh hiện tại và phạm vi của nó
- Đóng băng con trỏ trên một cây nến cụ thể bằng một cú nhấp, và mở khóa lại bằng một cú nhấp khi cần
- Gửi giá trị vào nhật ký của bạn để dễ dàng sao chép
- Hiển thị hoặc ẩn bố cục khi cần
Tùy chỉnh đầy đủ
- Cá nhân hóa màu sắc theo phong cách của bạn
- Điều chỉnh con trỏ đến bất kỳ vị trí nào bạn cần trong biểu đồ
- Chọn giá trị nào được hiển thị và giá trị nào nên bỏ qua
Hiển thị dữ liệu nến ngay lập tức
Chỉ cần di chuột lên bất kỳ cây nến nào để kiểm tra tất cả chi tiết và hơn thế nữa
- Chỉ số
- Hướng
- Ngày
- Thời gian
- Giá Y của chuột
- Mở cửa
- Cao
- Thấp
- Đóng cửa
- Khối lượng
- Kích thước thân nến
- Kích thước nến
- % Thay đổi
- Nhiều giá trị chỉ báo
-
- ADX
- ATR
- Dòng tiền Chaikin
- EMA, HMA, SMA, TSMA, TMA, WMA
- Khối lượng cân bằng
- RSI
- STD
- Đóng cửa có trọng số
- Làm mượt Welles Wilder
- Williams %R
- Vẽ đường ngang/dọc với các phím tắt dễ dàng
-
- Vẽ đường ngang: Ctrl + 1
- Vẽ đường dọc: Ctrl + 2
- Phím tắt hoàn toàn có thể tùy chỉnh
- Công thức tùy chỉnh
-
- Sử dụng Mở cửa, Cao, Thấp, Đóng cửa và Chỉ số để tính toán các công thức phù hợp với nhu cầu của bạn
- Ví dụ, Giá điển hình: (High[index] + Low[index] + Close[index])/3.0
Tích hợp liền mạch
- Giấy phép liên kết với ID cTrader của bạn để dễ sử dụng
- Bao gồm các cập nhật trong tương lai
Nâng cấp trải nghiệm giao dịch của bạn với Crosshair Edge ngay hôm nay! 🚀
Tóm tắt
Hồ sơ chỉ báo
Đánh giá của khách hàng
5.0
Đánh giá: 1
5 | 100 % | |
4 | 0 % | |
3 | 0 % | |
2 | 0 % | |
1 | 0 % |
Đánh giá của khách hàng
Thảo luận
Câu hỏi thường gặp
Indices
RSI
ATR
Các sản phẩm có sẵn trên cTrader Store, bao gồm bot giao dịch, chỉ báo và plugin, được cung cấp bởi các nhà phát triển bên thứ ba và chỉ nhằm mục đích cung cấp thông tin và tiếp cận kỹ thuật. cTrader Store không phải là nhà môi giới và không cung cấp lời khuyên đầu tư, khuyến nghị cá nhân hay bất kỳ đảm bảo nào về hiệu suất trong tương lai.


Giá
10
Lượt bán
346
Cài đặt miễn phí