

MACD Based Price Forecasting
อินดิเคเตอร์
เวอร์ชัน 1.0, Jul 2026
Windows, Mac

560.66M
ปริมาณการเทรด
9.78M
Pips ที่ได้กำไร
4
การขาย
คำอธิบาย
การพยากรณ์ราคาบนพื้นฐาน MACD
ภาพรวม
ตัวบ่งชี้นี้ก้าวข้ามข้อจำกัดของ MACD แบบดั้งเดิมโดยไม่จำกัดอยู่แค่การวิเคราะห์ในอดีต แต่ได้แนะนำ ความทรงจำในอดีตและอัลกอริทึมทางสถิติ เพื่อทำนายการเคลื่อนไหวของราคาที่จะเกิดขึ้นในอนาคต
กลไกหลัก:
- ความทรงจำแนวโน้มในอดีต: ตัวบ่งชี้บันทึกการเปลี่ยนแปลงราคาของแนวโน้ม MACD ในอดีต (ทั้งขาขึ้นและขาลง) เทียบกับจุดเริ่มต้นของแนวโน้มเหล่านั้น สร้างฐานข้อมูลสถิติของแนวโน้มล่าสุดสูงสุดถึง 50 แนวโน้ม
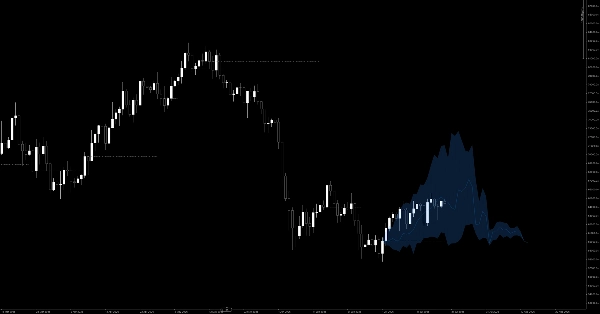
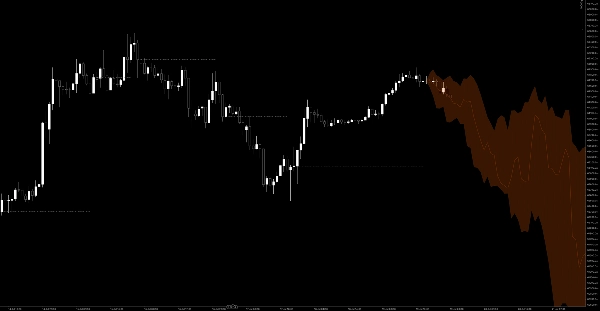
- พัดพยากรณ์ความน่าจะเป็น: เมื่อเกิดการตัดกันใหม่ของ MACD (ไม่ว่าจะตัดเส้นศูนย์หรือเส้นสัญญาณ) ตัวบ่งชี้จะดึงข้อมูลจากความทรงจำในอดีต คำนวณเปอร์เซ็นไทล์ที่ 20%, 50% และ 80% ของการเปลี่ยนแปลงราคา และฉาย พัดพยากรณ์ความน่าจะเป็นสำหรับ 100 แท่งถัดไป ทางด้านขวาของกราฟ
- เมฆพื้นที่สัญญาณแบบไดนามิก: มันทำเครื่องหมาย "ราคามาตรฐาน" ที่แนวโน้มกลับตัวเกิดขึ้น เมื่อราคาจริงอยู่เหนือราคามาตรฐานนี้ในแนวโน้มขาขึ้น จะมีการระบายสีเมฆสีเขียว; ในทางกลับกันจะระบายสีเมฆสีแดงในแนวโน้มขาลง ซึ่งช่วยยืนยันภาพทันทีถึงโมเมนตัมขาขึ้นหรือขาลงที่แท้จริง
(หมายเหตุ: ตัวบ่งชี้นี้มีการเรนเดอร์กราฟิกที่ปรับแต่งอย่างสูง ใช้การผสมผสานรูปหลายเหลี่ยมอย่างราบรื่นเพื่อโซนภาพที่ชัดเจนและเส้นอ้างอิงที่ไม่ต่อเนื่องอย่างละเอียดเพื่อประสบการณ์กราฟที่สะอาดอย่างไม่น่าเชื่อ)
กฎการเทรด & คู่มือผู้ใช้
ตัวบ่งชี้นี้ไม่ใช่แค่สัญญาณ "ซื้อ/ขายเมื่อเกิดการตัดกัน" ธรรมดาๆ—แต่ให้ แผนที่ความน่าจะเป็น สำหรับการเทรดของคุณ
1. การหาจุดเข้า (ยืนยันแนวโน้ม)
- จุดเข้าแบบยาว: เมื่อเกิดการตัดกัน MACD แบบขาขึ้น จะมี พัดพยากรณ์สีน้ำเงินที่ฉายขึ้นด้านบน ปรากฏทางขวา อย่ารีบเข้าโดยไม่คิด รอดูว่าราคาจะทรงตัวเหนือเส้นประจุด-ขีด (ราคามาตรฐาน) และ เมฆสีเขียวขาขึ้น เริ่มขยายออก นี่ยืนยันว่าโมเมนตัมปัจจุบันสอดคล้องกับสถิติขาขึ้นในอดีต ให้โอกาสที่มั่นคงในการซื้อในช่วงราคาปรับตัวลง
- จุดเข้าแบบสั้น: เมื่อเกิดการตัดกัน MACD แบบขาลง จะมี พัดพยากรณ์สีส้มที่ฉายลงด้านล่าง ปรากฏขึ้น มองหาราคาที่อยู่ต่ำกว่าเส้นอ้างอิงพร้อมกับ เมฆสีแดงขาลงที่ขยายออก เพื่อยืนยันการเข้าซื้อขายแบบสั้นในช่วงราคาปรับตัวขึ้น
2. การตั้งเป้าหมายทำกำไร
พัดพยากรณ์ทำหน้าที่เป็นแนวทางการทำกำไรแบบไดนามิกที่ยอดเยี่ยม:
- เป้าหมาย 1 (เส้นกลาง): เส้นกลางภายในพัดแสดงถึงเปอร์เซ็นไทล์ที่ 50% ในอดีต (เส้นทางเฉลี่ย) เมื่อราคาสัมผัสเส้นนี้ หมายความว่าการเคลื่อนไหวปัจจุบันได้บรรลุค่าเฉลี่ยในอดีตแล้ว เป็นจุดที่เหมาะสมในการทำกำไรบางส่วน
- เป้าหมาย 2 (ขอบนอกของพัด): ขอบบน (เปอร์เซ็นไทล์ 80%) หรือขอบล่าง (เปอร์เซ็นไทล์ 20%) แสดงถึงจุดสุดขีดในอดีต หากราคาถึงขอบเหล่านี้ โมเมนตัมจะหมดแรงอย่างมาก และมีโอกาสสูงที่จะเกิดการกลับตัวหรือปรับฐานลึก ควรพิจารณาปิดสถานะทั้งหมด
3. การวางจุดหยุดขาดทุนอย่างมีหลักการ
- เส้นประสีเทา (ราคามาตรฐาน) ทำหน้าที่เป็นเส้นฐานสำหรับทุกแนวโน้ม
- เมื่อเข้าเทรดแบบยาว ให้วางจุดหยุดขาดทุนต่ำกว่าเส้นสีเทานี้เล็กน้อย หากราคาทะลุราคามาตรฐานและเมฆสีเขียวหายไป หมายความว่าการเคลื่อนไหวของราคาจริงได้ทำให้ความน่าจะเป็นขาขึ้นในอดีตเป็นโมฆะ การตั้งค่าแนวโน้มล้มเหลว และคุณควรตัดขาดทุนทันที
4. ตัวกรองตลาดช่วงขาลง
- ถ้าเกิดการตัดกันของ MACD แต่ พัดพยากรณ์ที่ฉายออกมาราบเรียบหรือหดตัวมาก หมายความว่าในอดีตการตัดกันแบบนี้มักส่งผลให้เกิดการเคลื่อนไหวแบบแกว่งตัวไปมาในแนวราบ
- เมื่อเห็นพัดที่ราบเรียบ ให้หยุดพักและหลีกเลี่ยงการเทรด รอรอบถัดไปที่พัดแสดงการขยายตัวขึ้นหรือลงอย่างชัดเจน
สรุป
สรุปโดย AI
MACD Based Price Forecasting is a technical indicator that extends traditional MACD analysis by incorporating historical memory and statistical algorithms to predict future price movements. It records price displacements from up to 50 recent MACD trends, both bullish and bearish, creating a statistical database for forecasting.
Key features include a probability forecasting fan that projects 20%, 50%, and 80% price change percentiles for the next 100 bars following a MACD crossover. The indicator visually displays this fan on the chart, with blue fans for bullish signals and orange for bearish. A dynamic signal area cloud highlights momentum: green for confirmed uptrends above a reference price and red for downtrends below it.
Trading guidance involves waiting for price confirmation above or below the reference price and cloud before entering long or short positions. The forecasting fan also serves as a dynamic take-profit guide, with the middle line representing average historical moves and outer edges indicating potential trend exhaustion. Stop-loss placement is recommended just beyond the reference price line to manage risk.
Additionally, the indicator filters ranging markets by identifying flat or contracted fans, signaling sideways price action and advising traders to avoid entering trades during such periods. The indicator supports visualization outputs and is tagged under MACD and momentum indicators.
Key features include a probability forecasting fan that projects 20%, 50%, and 80% price change percentiles for the next 100 bars following a MACD crossover. The indicator visually displays this fan on the chart, with blue fans for bullish signals and orange for bearish. A dynamic signal area cloud highlights momentum: green for confirmed uptrends above a reference price and red for downtrends below it.
Trading guidance involves waiting for price confirmation above or below the reference price and cloud before entering long or short positions. The forecasting fan also serves as a dynamic take-profit guide, with the middle line representing average historical moves and outer edges indicating potential trend exhaustion. Stop-loss placement is recommended just beyond the reference price line to manage risk.
Additionally, the indicator filters ranging markets by identifying flat or contracted fans, signaling sideways price action and advising traders to avoid entering trades during such periods. The indicator supports visualization outputs and is tagged under MACD and momentum indicators.
โปรไฟล์อินดิเคเตอร์
หมวดหมู่อินดิเคเตอร์
Trend
ประเภทเอาต์พุต
การแสดงเป็นภาพ
ข้อกำหนดด้านข้อมูล
แท่งเท่านั้น
ปริมาณ
ข้อมูล Tick
สัญญาณที่รองรับ
Cross
Divergence
Breakout
Reversal
ความแข็งแกร่งของแนวโน้ม
ความผันผวน
การสนทนา
รีวิวจากลูกค้า
0.0
รีวิว: 0
รีวิวจากลูกค้า
ยังไม่มีรีวิวสำหรับผลิตภัณฑ์นี้ หากเคยลองแล้ว ขอเชิญมาเป็นคนแรกที่บอกคนอื่น!
คำถามที่พบบ่อย
MACD
ผลิตภัณฑ์ที่มีให้บริการผ่าน cTrader Store รวมถึงบอทการเทรด อินดิเคเตอร์ และปลั๊กอิน มีให้บริการโดยนักพัฒนาบุคคลที่สามและมีไว้เพื่อวัตถุประสงค์ในการเข้าถึงข้อมูลและทางเทคนิคเท่านั้น cTrader Store ไม่ใช่โบรกเกอร์และไม่ได้ให้คำแนะนำการลงทุน คำแนะนำส่วนบุคคล หรือการรับประกันผลการดำเนินงานในอนาคต
เพิ่มเติมจากผู้เขียนคนนี้

















ราคา
560.66M
ปริมาณการเทรด
9.78M
Pips ที่ได้กำไร
4
การขาย