
Half Trend BT
Indicateur
38 achats
Version 1.0, Mar 2025
Windows, Mac
4.3
Avis : 3
Description
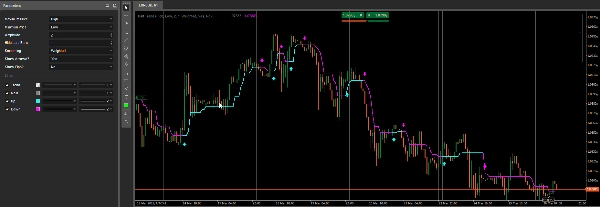
L'indicateur Half Trend est conçu pour détecter et mettre en évidence les retournements de tendance potentiels en comparant les plus hauts et les plus bas récents sur une période spécifiée, puis en traçant une ligne « Up » ou « Down » en conséquence. Il dessine éventuellement des flèches à chaque changement de tendance et peut afficher les différences de pips entre les signaux.
- Sélection de la série Haut/Bas
- L'indicateur utilise deux séries de prix (Haut et Bas par défaut) pour suivre les maxima et minima locaux.
- Vous pouvez sélectionner différents types de prix (par exemple,
Open,Close,Median, etc.) pour chaque série via Maximum Price et Minimum Price.
- Moyennes mobiles & calcul de période
- Une moyenne mobile (basée sur le type de lissage choisi et la période d'amplitude) est appliquée aux séries de prix « haut » et « bas » sélectionnées.
- L'indicateur compare les prix actuels des barres à ces niveaux lissés haut/bas pour décider s'il faut passer d'une tendance haussière à une tendance baissière (ou inversement).
- Détection et tracé de la tendance
- Si l'indicateur identifie une tendance haussière, il trace la ligne Up (cyan) et définit
Trendà+1. - S'il détecte une tendance baissière, il trace la ligne Down (magenta) et définit
Trendà-1. - La sortie Main (gris) se met à jour en interne pour refléter les niveaux actuels de support/résistance.
Trendest une série de sortie invisible stockant numériquement la direction de la tendance (+1ou-1).
- Si l'indicateur identifie une tendance haussière, il trace la ligne Up (cyan) et définit
- Flèches & calcul des pips
- Afficher les flèches ? – Si activé, l'indicateur dessine une flèche sur chaque nouvelle barre où un retournement de tendance est détecté.
- Afficher les pips ? – Si activé, il calcule et affiche la différence de pips entre le dernier signal et le nouveau signal, dessinant une petite étiquette et une ligne de tendance sur le graphique.
Résumé
Résumé IA
The Half Trend BT indicator detects potential trend reversals by analyzing recent highs and lows over a specified period. It compares two selected price series—typically High and Low, but configurable to other price types such as Open, Close, or Median—using moving averages based on chosen smoothing methods and amplitude periods. The indicator plots an "Up" line (cyan) when an uptrend is detected and a "Down" line (magenta) for a downtrend, while internally storing trend direction numerically (+1 or -1). A main output line (gray) reflects current support and resistance levels. Optional features include drawing arrows on bars where trend reversals occur and calculating pip differences between signals, which are displayed as labels and trendlines on the chart. This indicator supports multiple markets including Forex, indices, commodities, cryptocurrencies, and stocks.
Profil de l'indicateur
Avis clients
4.3
Avis : 3
5 | 33 % | |
4 | 67 % | |
3 | 0 % | |
2 | 0 % | |
1 | 0 % |
Avis clients
March 29, 2025
Clean idea for traders around chart reading. The useful part is adding confirmation before a trade, with the numbers checked before scaling. The cleaner reads should hold across 3 sessions, not just 1 good chart. It is stronger when a 1.5R target is realistic before the entry.
March 28, 2025
March 28, 2025
Decent tool for testing if the trader wants it makes market context easier to scan. It works best as support, not a final decision maker. I would test it on 2 timeframes, 20 signals and a 1R stop plan. it should not be used as a blind entry trigger.
Discussion
Questions fréquentes
Prop
Forex
Signal
Indices
Commodities
Crypto
Stocks
Les produits disponibles sur cTrader Store, notamment les bots de trading, les indicateurs et les plug-ins, sont fournis par des développeurs tiers et mis à disposition à titre informatif et à des fins d'accès technique uniquement. cTrader Store n'est pas un courtier et ne fournit aucun conseil en investissement, aucune recommandation personnelle ni aucune garantie quant aux performances futures.


![Logo de "[Stellar Strategies] MARSI Signal Plotter"](https://cdn.ctrader.com/image/webp/7b2b8da6-8f8e-4646-8d4a-4710c516c01e_25567)


Prix
48
Ventes
1.04K
Installations gratuites