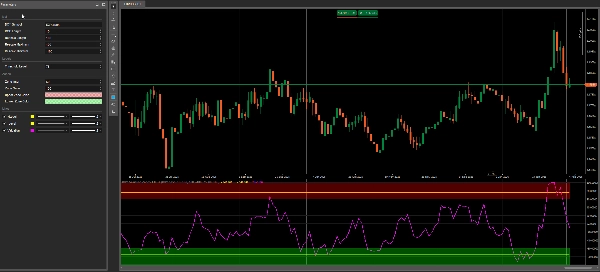
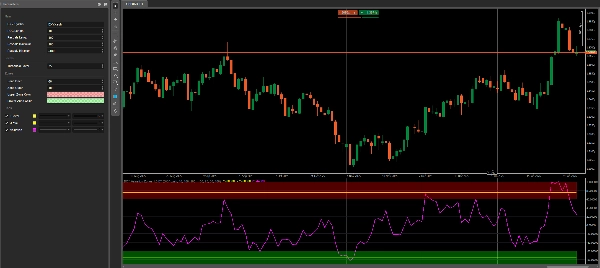
DXY Valuation Zones 1.0 BT
Indicateur
Version 1.0, Feb 2026
Windows, Mac
Image mise en ligne de "DXY Valuation Zones 1.0 BT"Image mise en ligne de "DXY Valuation Zones 1.0 BT"
18
Ventes
461
Installations gratuites
À propos de la version d'essai
14 Days Trial

DXY Valuation Zones 1.0 BT shows a clean DXY-relative valuation line for your chart symbol and highlights two simple context areas: an Over Zone and an Under Zone.
It’s built as a Daily (D1) context filter — no clutter, just clear zones + a configurable ±Threshold level.

All zone colors use the native cTrader color picker, so you can control transparency directly via the opacity slider inside the palette.

Recommended Use (Best on Daily)

This indicator works best on USD-related pairs, because DXY represents broad USD strength.

Examples:

  • XXXUSD: EURUSD, GBPUSD, AUDUSD, NZDUSD
  • USDXXX: USDJPY, USDCAD, USDCHF

Quick Start (recommended defaults)

  • Timeframe: Daily (D1)
  • Over Zone: +70 … +100
  • Under Zone: -70 … -100
  • Threshold: ±75 (adjustable)
  • DXY Symbol: DXY.cash (or your broker’s DXY name)


How it works (simple)

  1. Calculates ROC (percent change) for your chart symbol
  2. Calculates the same ROC for DXY
  3. Uses the difference (Symbol ROC – DXY ROC)
  4. Rescales the result into a stable -100 … +100 range


How to read it

  • Valuation > +Threshold → stretched / “Over” context
  • Valuation < -Threshold → stretched / “Under” context
  • In-between → neutral context

Use it as a bias & location filter, not as a standalone entry signal.


Important (Broker requirement)

This indicator requires a broker-provided DXY symbol (example: DXY.cash).
Tested on FTMO (availability and naming may vary by broker feed).
If your broker uses a different name, just change the DXY Symbol pa

0.0
Avis : 0
Avis clients
Il n'y a pas encore d'avis sur ce produit. Vous l'avez déjà essayé ? Soyez le premier à en parler aux autres !
Prop
Forex
Signal

Plus de cet auteur

Indicateur
Forex
Signal
Market Session BT
Market Session BT
Indicateur
Indices
Prop
Commodities
+4
Half Trend BT
Half Trend BT by BullittTraders
Indicateur
Indices
Prop
Commodities
+3
Camarilla 1.5 BT
Camarilla by Bullitt Traders — a precise, non-repainting pivot indicator for cTrader.
Indicateur
Indices
Prop
Commodities
+3
HMA MTF 2.0
HMA MTF 2.0 (Multi-Timeframe )
Indicateur
Indices
Prop
Stocks
+3
Bar Time
Bar Time Timeframe / Renko
Indicateur
Indices
Breakout
Prop
+2
Price Change Bundle 1.0 BT
Price Change Bundle 3-in-1 Levels • Bars • Histogram. Secret of Price Change
Indicateur
NAS100
NZDUSD
Indices
+9
Belkhayate PRC BT
Belkhayate PRC (Polynomial Regression Channel)
Indicateur
Indices
Breakout
Prop
+6
Price Level DWM BT
Price Level DWM BT
Indicateur
NAS100
NZDUSD
XAUUSD
+11
Half Trend Cloud BT
Half Trend Cloud

Vous pourriez aussi aimer

Breakout Mode Patterns
Brooks price action breakout mode patterns
Indicateur
Indices
Prop
Stocks
+5
ElliottWave
Elliott Wave Structure Pro v2.0 (Non-Repainting) Structure, Elliott, Continuation Entries
Zero Lag Exponential Moving Average
ZLEMA (Zero Lag EMA) is a faster, smoother version of EMA, ideal for capturing quick market shifts and trends.
Indicateur
RSI
Commodities
Signal
+1
Dot Momentum %BB Indicator
Dynamic circles visualize price's volatility position. Like RSI for market overextension & stretch. Quantify context.
Daily Open Pivot Level
This indicator is a valuable tool for traders looking to identify significant opening price level of any asset.
Indicateur
RSI
Breakout
Lozano Price Action
LPA simplifies trading by coloring candles with volume data and RSI levels for trend and reversal insights.
Indicateur
NAS100
NZDUSD
Martingale
+26
True Deviation System
True Deviation System – Precision Meets Professional Trading
VWAP Tokyo Open
VWAP Set to Tokyo Open
SessionPowerZonesPro
Highlights market sessions & overlaps with real-time range & volume stats – perfect for pro scalpers.
Indicateur
NAS100
Indices
XAUUSD
+3
Risk Appetite - Directional Bias-PRO
“Read risk. Catch direction. Trade with confidence — join us for the best optimizations & tools.” 🚀
Zig zag v.1 Demo
ZigZag Pro DEMO – Multi-Swing Indicator for cTrader DEMO VERSION – 24 hours free trial! This is a DEMO version of the Z
Indicateur
RSI
Breakout
XAUUSD
+6
Volume POC Heatmap
📊 Shows volume by price levels, highlights POC, and key zones. Identifies dynamic support/resistance and imbalances.
18
Ventes
461
Installations gratuites