

Mô tả
HỒ SƠ KHỐI LƯỢNG SWING (SVP)
Hồ sơ khối lượng dựa trên Swing + Fibonacci + RSI
--------------------------------------------------
Phát hiện swing. Hồ sơ khối lượng. Fibonacci. RSI. Tất cả trong một.
--------------------------------------------------
CÔNG DỤNG CỦA CHỈ BÁO NÀY
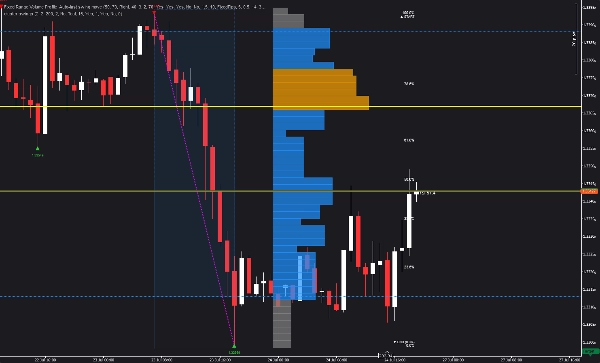
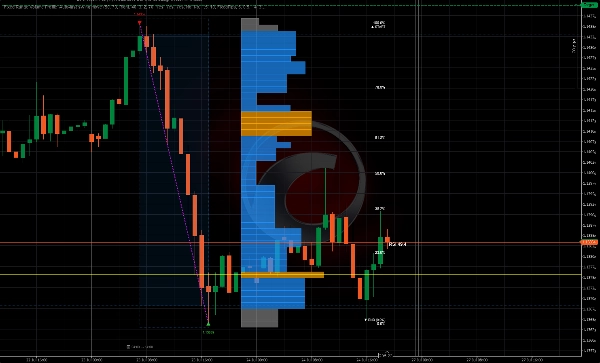
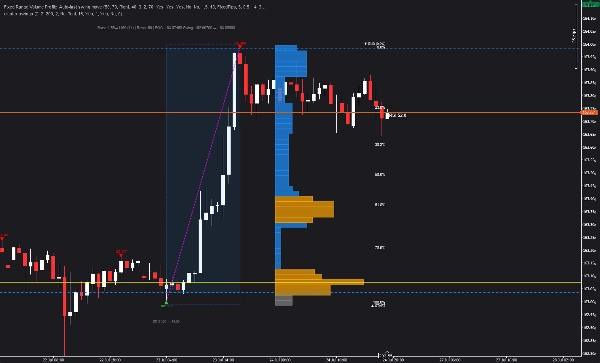
Swing Volume Profile (SVP) tự động phát hiện các swing cấu trúc và hiển thị hồ sơ khối lượng cho swing hoàn thành gần nhất — với lớp phủ Fibonacci retracement và RSI.
Không cần chọn phạm vi thủ công. Chỉ báo tự tìm các swing và xây dựng hồ sơ tự động.
--------------------------------------------------
TÍNH NĂNG CHÍNH
- PHÁT HIỆN SWING TỰ ĐỘNG (độ sâu và độ lệch có thể cấu hình)
- Hồ sơ khối lượng cho swing hoàn thành cuối cùng
- Điểm kiểm soát (POC) - mức khối lượng cao nhất
- Khu vực giá trị (VAH + VAL) - phần trăm có thể cấu hình
- Nút khối lượng cao (HVN) - khối lượng trên ngưỡng trung bình
- Fibonacci Retracement (0, 23.6, 38.2, 50, 61.8, 78.6, 100)
- Lớp phủ RSI gần giá hiện tại
- Vị trí biểu đồ thanh: Trái, Phải hoặc Gần các thanh
- Số hàng có thể cấu hình (10 đến 200)
- Màu sắc và độ mờ tùy chỉnh
- Kéo dài các đường sang bên phải
- Hiển thị/ẩn nhãn giá
- Không vẽ lại
--------------------------------------------------
CÁCH HOẠT ĐỘNG
1. Chỉ báo phát hiện các swing sử dụng độ sâu và độ lệch có thể cấu hình
2. Xác định swing hoàn thành cuối cùng
3. Tính toán hồ sơ khối lượng từ phạm vi swing
4. Hiển thị POC, VAH, VAL, HVN
5. Lớp phủ Fibonacci retracement trên swing
6. Hiển thị RSI hiện tại gần giá
Tất cả tự động. Không cần nhập liệu thủ công.
--------------------------------------------------
YẾU TỐ HÌNH ẢNH
- Tam giác đỏ hướng xuống = Đỉnh swing
- Tam giác xanh hướng lên = Đáy swing
- Đường chấm magenta = Kết nối swing
- Đường ngang màu vàng = Điểm kiểm soát (POC)
- Đường nét đứt màu xanh = Giá trị vùng cao (VAH) và giá trị vùng thấp (VAL)
- Thanh màu cam = Nút khối lượng cao (HVN)
- Thanh màu xám = Nút khối lượng thấp
- Đường ngang màu vàng kim = Mức Fibonacci
- Nhãn màu trắng = Phần trăm Fibonacci
- Giá trị RSI = RSI hiện tại gần giá
--------------------------------------------------
TỔNG QUAN THAM SỐ
CÀI ĐẶT HỒ SƠ:
- Số hàng: Bao nhiêu hàng giá (10-200)
- Phần trăm khu vực giá trị: % khối lượng trong khu vực giá trị (1-100)
CÀI ĐẶT HÌNH ẢNH:
- Vị trí biểu đồ thanh: Phải, Trái, Gần các thanh hoặc Gần các thanh bên trái
- Phần trăm chiều rộng biểu đồ thanh: Chiều rộng các thanh biểu đồ
- Tỷ lệ chiều rộng thanh: Hệ số tỷ lệ cho chiều rộng thanh
- Phần trăm chiều rộng thanh tối thiểu: Chiều rộng thanh tối thiểu
- Độ mờ thanh: Độ trong suốt của các thanh (10-100)
PHÁT HIỆN SWING:
- Độ sâu swing: Bao nhiêu thanh để kiểm tra cực trị cục bộ
- Chế độ lệch: Pips cố định hoặc dựa trên ATR
- Lệch cố định: Khoảng cách pip tối thiểu giữa các swing
- Hệ số lệch ATR: Hệ số cho lệch dựa trên ATR
- Chu kỳ ATR: Chu kỳ tính ATR
- Khoảng cách ngược: Số thanh tối thiểu giữa các swing
HÌNH ẢNH - SWING:
- Hiển thị đường swing: Bật/tắt đường swing màu magenta
- Màu đường swing
- Hiển thị nhãn swing: Bật/tắt nhãn giá
- Màu swing cao/thấp
HÌNH ẢNH - FIBONACCI:
- Hiển thị Fib Retracement: Bật/tắt lớp phủ Fibonacci
- Hiển thị đường Fib: Bật/tắt các đường ngang
- Hiển thị nhãn Fib: Bật/tắt nhãn phần trăm
- Màu đường Fib / Màu chữ Fib
HÌNH ẢNH - RSI:
- Hiển thị giá trị RSI: Bật/tắt lớp phủ RSI
- Chu kỳ RSI: Chu kỳ tính RSI
- Màu nhãn RSI
MÀU SẮC:
- Màu POC / Màu khu vực giá trị / Màu nút khối lượng cao / Màu nút khối lượng thấp
--------------------------------------------------
TRƯỜNG HỢP SỬ DỤNG
- Xác định các swing và phân bố khối lượng trong một cái nhìn
- Tìm Điểm kiểm soát (POC) cho việc vào và thoát lệnh
- Sử dụng Khu vực giá trị (VAH/VAL) làm mục tiêu lợi nhuận
- Phát hiện Nút khối lượng cao (HVN) cho các mức quan trọng
- Áp dụng Fibonacci retracement cho swing
- Xác nhận giao dịch với sự hội tụ RSI
- Hiểu phân bố khối lượng chỉ trong nháy mắt
--------------------------------------------------
NÂNG CẤP ĐẾN CÁC VÙNG NHIỆT CẤU TRÚC
Chỉ báo này hiển thị cho bạn các swing và phân bố khối lượng.
Structural Heat Zones đi xa hơn — nó lập bản đồ cường độ tham gia, chấp nhận so với từ chối, và sự tham gia thị trường qua nhiều vùng.
Tìm kiếm Structural Heat Zones trong cửa hàng cTrader.
--------------------------------------------------
NÂNG CẤP ĐẾN INVICTUS EA
Invictus EA sử dụng công nghệ cấu trúc để thực hiện các giao dịch tự động.
Tìm kiếm Invictus trong cửa hàng cTrader.
--------------------------------------------------
GHI CHÚ KỸ THUẬT
- Chỉ báo lớp phủ
- Hoạt động trên mọi khung thời gian và ký hiệu
- Không vẽ lại (tính toán lịch sử)
- Tối ưu hóa hiệu suất
--------------------------------------------------
HỖ TRỢ
Cập nhật trọn đời được bao gồm.
ĐỂ BIẾT THÊM THÔNG TIN - Nhấp vào Hồ sơ Nhà phát triển bên dưới.
Tóm tắt
The indicator identifies swings using configurable parameters such as swing depth and deviation mode (fixed pips or ATR-based), then computes volume distribution within the swing range without requiring manual range selection. Visual elements include colored markers for swing highs and lows, volume nodes, Fibonacci levels, and RSI values, all customizable in terms of color, opacity, and histogram positioning.
Key features include no repainting, configurable rows for volume profile resolution, extendable lines, and toggleable price labels. Use cases focus on identifying swing structures, volume distribution, key price levels, and confluences for trade entries, exits, and profit targets. The indicator is optimized for performance and provides lifetime updates.
























![Logo "[Stellar Strategies] Inside Bar with Signals"](https://cdn.ctrader.com/image/webp/1d9e8bfa-3b2c-4440-bb37-5856902008a7_30683)


![Logo "[Stellar Strategies] Market Session Ultimate"](https://cdn.ctrader.com/image/webp/61ffd537-0125-4246-9e72-42eca1791d64_28232)

