
Description
The Support & Resistance Toolkit is a comprehensive market structure analysis indicator designed to help traders identify high-probability support and resistance zones on charts. By combining multiple advanced pivot point detection algorithms with adaptive volatility zones, institutional money flow filters, and liquidity analysis, this toolkit transforms traditional support and resistance lines into a data-driven strategic tool.
Detection
This toolkit includes four advanced detection methodologies designed to suit different trading styles and market environments:
- Pivots: The classic support and resistance detection approach using configurable left and right lookback strengths to detect local highs and lows.
- Donchian: A high-performance state-machine algorithm that detects alternating swing structures. Rather than using fixed lag, it confirms extremes when the market shifts directional state.
- CSID:A momentum-driven detection method that identifies structural turning points based on consecutive bullish or bearish candles, highlighting strong trend initiation zones.
- ZigZag:A volatility-based algorithm that filters minor price fluctuations by requiring a minimum percentage deviation before identifying a swing.
Zone / Level
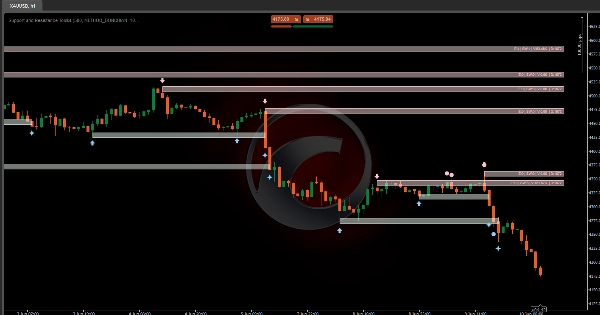
Unlike conventional indicators that simply draw fixed lines, this tool treats support and resistance levels as dynamic price zones based on the following features:
- Zone Depth (ATR Mult): Determines the thickness of each zone based on the Average True Range. This allows zones to scale automatically with market volatility.
- Breakout Buffer (ATR Mult): A unique security buffer that extends the zone beyond the breakout side. Price must move beyond this additional volatility layer before the indicator confirms a breakout, reducing false signals and fakeouts.
Filtering & Visibility:
- Merge Overlapping: Combines intersecting zones into a larger “Super Zone” that represents the full historical interaction range.
- Hide Oldest First: Prioritizes recent market structure by hiding older zones when overlap occurs.
- Hide Youngest First: Preserves established historical structures by ignoring smaller new zones that appear within existing ranges.
Level Filtering ( E:Entries | S:Strength | SW:Sweeps | V:Volume | D:Duration )
- Price Entries (E): Requires a level to be re-tested a specified number of times before appearing on the chart.
- Sweeps (SW): Detects liquidity traps where price briefly violates a level with a wick but closes back inside the zone.
- Traded Volume (V): Tracks the total traded volume that occurs while price interacts with the zone, highlighting institutional participation.
- Duration (D): Requires zones to survive for a minimum number of bars before being considered valid structural levels.
Visual Signals
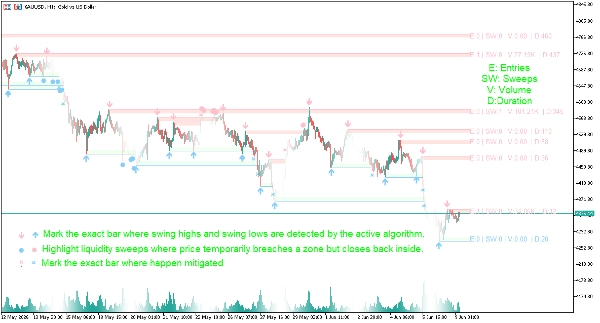
- ⬆/⬇ Arrows: Mark the exact bar where swing highs and swing lows are detected by the active algorithm.
- ● Large Dots: Highlight liquidity sweeps where price temporarily breaches a zone but closes back inside.
- ✖ Cross: Mark the exact bar where swing highs and swing lows are migrated.
- Summary labels: Each display area features a concise data label including the parameters E (Entries), S (Strength), SW (Sweeps), V (Volume), and D (Duration), allowing users to quickly assess the structural quality.
Dashboard
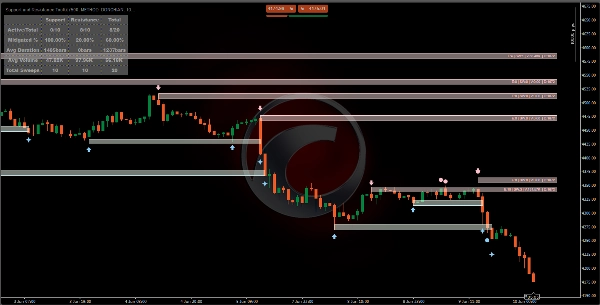
- Active / Total: Displays how many structures are currently active compared to the total detected historically.
- Mitigation %: Measures how frequently levels are broken or mitigated, providing insight into market structure reliability.
- Avg Duration: The average number of bars a support or resistance zone survives before being broken.
- Avg Volume: Indicates the average institutional participation within zones before a breakout occurs.
- Total Sweeps: Tracks liquidity hunting behavior across the market.
Indicator Settings
Detection Settings
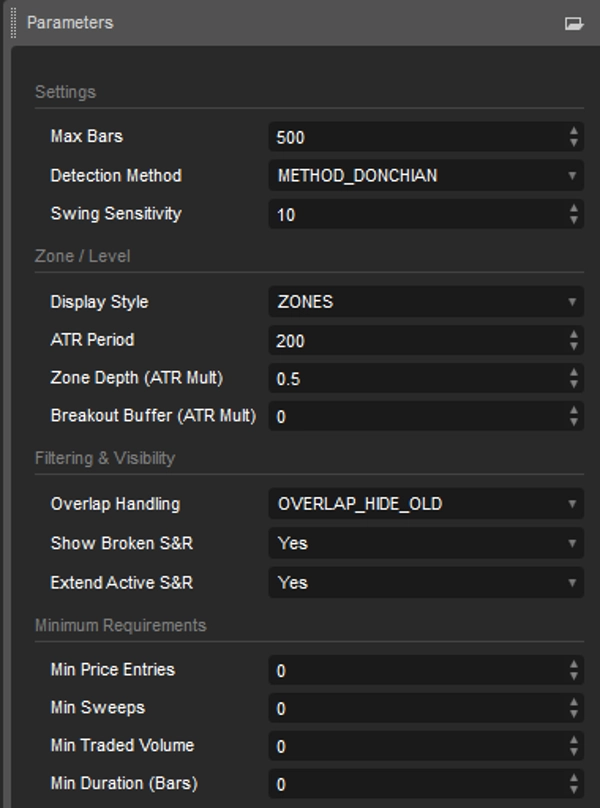
- Detection Method: Select between Pivots, Donchian, CSID, or ZigZag swing detection logic.
- Swing Sensitivity: Adjusts the required deviation or lookback length needed to confirm swing highs and lows.
Zone & Level Configuration
- Display Style: Switch between precise horizontal support and resistance lines or ATR-based zones.
- ATR Period: Determines the volatility period used for zone calculations.
- Zone Depth (ATR Mult): Adjusts the thickness of support and resistance zones.
- Breakout Buffer (ATR Mult): Adds a volatility buffer to filter out false breakouts.
Chart Visibility & Structure Control
- Overlap Handling: Choose how overlapping zones are handled (Merge, Hide Oldest, or Hide Youngest).
- Max Active (Unmitigated): Limits the number of active support and resistance zones displayed on the chart.
- Show Broken S&R: Toggle whether broken levels remain visible for historical analysis.
- Extend Active S&R: Projects active levels into future price bars.
Minimum Structural Requirements
- Min Price Entries: Sets the required number of re-tests before a level becomes visible.
- Min Sweeps: Requires a certain number of liquidity sweeps before displaying the zone.
- Min Traded Volume: Ensures zones meet a minimum institutional participation threshold.
- Min Duration (Bars): Requires levels to exist for a specified number of bars before they appear.
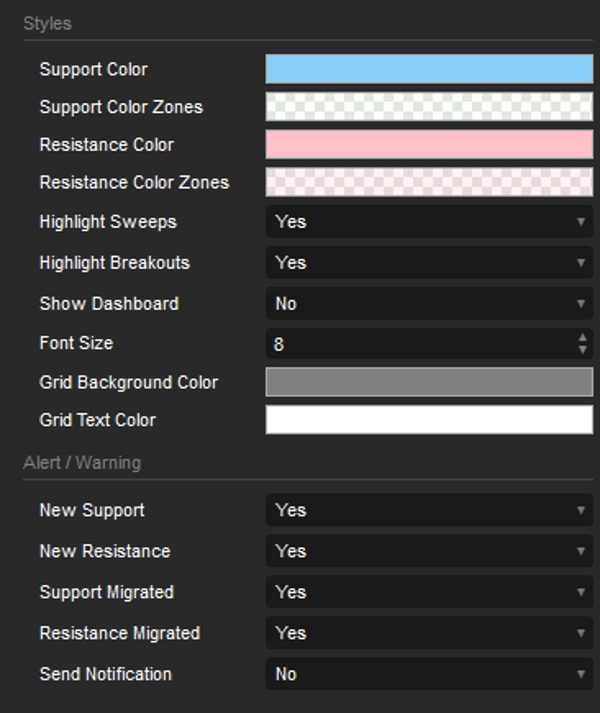
Styles and Alert
- Styles: Adjust object color configuration. Hide/Show Dashboard.
- Alert: Turn alerts on/off whenever a new S&R is detected or an S&R is migrated.
Summary
Unlike traditional fixed lines, this tool defines support and resistance as dynamic price zones, with thickness and breakout buffers scaled by Average True Range (ATR) to adapt to market volatility. It features zone merging and selective visibility options to manage overlapping zones, prioritizing recent or historical structures as needed.
The indicator applies multiple filters based on price re-tests, liquidity sweeps, traded volume, and zone duration to validate structural levels. Visual signals include arrows marking swing points, dots highlighting liquidity sweeps, crosses for migrated swings, and summary labels displaying entries, strength, sweeps, volume, and duration metrics.
A dashboard provides real-time statistics on active versus total structures, mitigation percentages, average zone duration, volume, and liquidity sweep counts. Users can customize detection methods, sensitivity, zone display styles, ATR parameters, overlap handling, and structural requirements. Alerts can be enabled for new or migrated support and resistance levels.
This toolkit supports detailed market structure analysis with data-driven, volatility-adjusted zones to assist traders in identifying key price areas.


